
Page 198 - Libro 2
P. 198
178
PART 3 — PERIPHERAL ARTERIAL
An arteriovenous fistula is a complication unique to in situ bypass grafts. This type of fistula occurs when a branch of the great saphenous vein connects, directly or indirectly, via a perforator with the deep venous system and is left unligated after creation of the bypass. A perforating vein normally has valves that direct flow from the superficial to the deep ve- nous system. Thus, once the great saphenous vein is arterialized as a bypass conduit, there is no imped- ance to blood flow through the bypass graft, into the perforating vein (now acting as a fistula), and into the deep venous system. This low resistance path can di- vert a great deal of blood flow into the venous system. The Doppler spectrum of the bypass graft proximal to the level of the fistula will display constant antegrade flow. Distal to the fistula, the bypass graft Doppler spectrum will exhibit little or no diastolic flow.
A blunted, monophasic pattern with zero dia- stolic flow is abnormal. This type of waveform indi- cates an abnormally high resistance to flow distally (Fig. 11-19). This is often associated with a stenosis or occlusion distally within the bypass or outflow vessels. This can sometimes progress to a staccato waveform with minimal forward flow in systole.
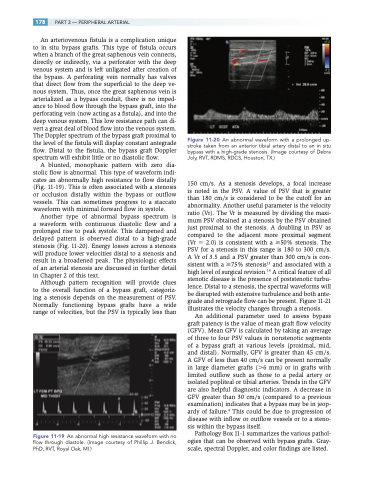
Another type of abnormal bypass spectrum is a waveform with continuous diastolic flow and a prolonged rise to peak systole. This dampened and delayed pattern is observed distal to a high-grade stenosis (Fig. 11-20). Energy losses across a stenosis will produce lower velocities distal to a stenosis and result in a broadened peak. The physiologic effects of an arterial stenosis are discussed in further detail in Chapter 2 of this text.
Although pattern recognition will provide clues to the overall function of a bypass graft, categoriz- ing a stenosis depends on the measurement of PSV. Normally functioning bypass grafts have a wide range of velocities, but the PSV is typically less than
Figure 11-19 An abnormal high resistance waveform with no flow through diastole. (Image courtesy of Phillip J. Bendick, PhD, RVT, Royal Oak, MI.)
Figure 11-20 An abnormal waveform with a prolonged up- stroke taken from an anterior tibial artery distal to an in situ bypass with a high-grade stenosis. (Image courtesy of Debra Joly, RVT, RDMS, RDCS, Houston, TX.)
150 cm/s. As a stenosis develops, a focal increase is noted in the PSV. A value of PSV that is greater than 180 cm/s is considered to be the cutoff for an abnormality. Another useful parameter is the velocity ratio (Vr). The Vr is measured by dividing the maxi- mum PSV obtained at a stenosis by the PSV obtained just proximal to the stenosis. A doubling in PSV as compared to the adjacent more proximal segment (Vr 2.0) is consistent with a 50% stenosis. The PSV for a stenosis in this range is 180 to 300 cm/s. A Vr of 3.5 and a PSV greater than 300 cm/s is con- sistent with a 75% stenosis13 and associated with a high level of surgical revision.14 A critical feature of all stenotic disease is the presence of poststenotic turbu- lence. Distal to a stenosis, the spectral waveforms will be disrupted with extensive turbulence and both ante- grade and retrograde flow can be present. Figure 11-21 illustrates the velocity changes through a stenosis.
An additional parameter used to assess bypass graft patency is the value of mean graft flow velocity (GFV). Mean GFV is calculated by taking an average of three to four PSV values in nonstenotic segments of a bypass graft at various levels (proximal, mid, and distal). Normally, GFV is greater than 45 cm/s. A GFV of less than 40 cm/s can be present normally in large diameter grafts (6 mm) or in grafts with limited outflow such as those to a pedal artery or isolated popliteal or tibial arteries. Trends in the GFV are also helpful diagnostic indicators. A decrease in GFV greater than 30 cm/s (compared to a previous examination) indicates that a bypass may be in jeop- ardy of failure.4 This could be due to progression of disease with inflow or outflow vessels or to a steno- sis within the bypass itself.
Pathology Box 11-1 summarizes the various pathol- ogies that can be observed with bypass grafts. Gray- scale, spectral Doppler, and color findings are listed.
