
Page 319 - Libro 2
P. 319
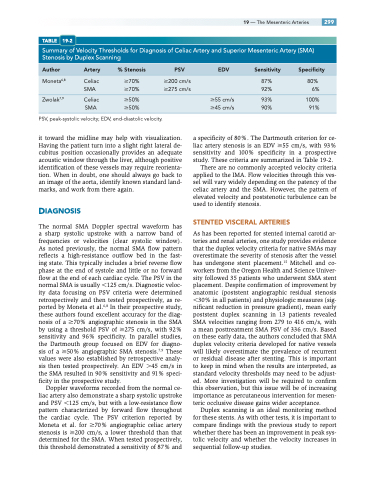
TABLE 19-2
Summary of Velocity Thresholds for Diagnosis of Celiac Artery and Superior Mesenteric Artery (SMA) Stenosis by Duplex Scanning
Author Artery %Stenosis PSV EDV Sensitivity Specificity
19 — The Mesenteric Arteries 299
Moneta6,8 Celiac 70% SMA 70%
Zwolak7,9 Celiac 50% SMA 50%
PSV, peak-systolic velocity; EDV, end-diastolic velocity.
200 cm/s 275 cm/s
87% 80% 92% 6%
93% 100% 90% 91%
55 cm/s 45 cm/s
it toward the midline may help with visualization. Having the patient turn into a slight right lateral de- cubitus position occasionally provides an adequate acoustic window through the liver, although positive identification of these vessels may require reorienta- tion. When in doubt, one should always go back to an image of the aorta, identify known standard land- marks, and work from there again.
DIAGNOSIS
The normal SMA Doppler spectral waveform has a sharp systolic upstroke with a narrow band of frequencies or velocities (clear systolic window). As noted previously, the normal SMA flow pattern reflects a high-resistance outflow bed in the fast- ing state. This typically includes a brief reverse flow phase at the end of systole and little or no forward flow at the end of each cardiac cycle. The PSV in the normal SMA is usually 125 cm/s. Diagnostic veloc- ity data focusing on PSV criteria were determined retrospectively and then tested prospectively, as re- ported by Moneta et al.6,8 In their prospective study, these authors found excellent accuracy for the diag- nosis of a 70% angiographic stenosis in the SMA by using a threshold PSV of 275 cm/s, with 92% sensitivity and 96% specificity. In parallel studies, the Dartmouth group focused on EDV for diagno- sis of a 50% angiographic SMA stenosis.7,9 These values were also established by retrospective analy- sis then tested prospectively. An EDV 45 cm/s in the SMA resulted in 90% sensitivity and 91% speci- ficity in the prospective study.
Doppler waveforms recorded from the normal ce- liac artery also demonstrate a sharp systolic upstroke and PSV 125 cm/s, but with a low-resistance flow pattern characterized by forward flow throughout the cardiac cycle. The PSV criterion reported by Moneta et al. for 70% angiographic celiac artery stenosis is 200 cm/s, a lower threshold than that determined for the SMA. When tested prospectively, this threshold demonstrated a sensitivity of 87% and
a specificity of 80%. The Dartmouth criterion for ce- liac artery stenosis is an EDV 55 cm/s, with 93% sensitivity and 100% specificity in a prospective study. These criteria are summarized in Table 19-2.
There are no commonly accepted velocity criteria applied to the IMA. Flow velocities through this ves- sel will vary widely depending on the patency of the celiac artery and the SMA. However, the pattern of elevated velocity and poststenotic turbulence can be used to identify stenosis.
STENTED VISCERAL ARTERIES
As has been reported for stented internal carotid ar- teries and renal arteries, one study provides evidence that the duplex velocity criteria for native SMAs may overestimate the severity of stenosis after the vessel has undergone stent placement.15 Mitchell and co- workers from the Oregon Health and Science Univer- sity followed 35 patients who underwent SMA stent placement. Despite confirmation of improvement by anatomic (poststent angiographic residual stenosis 30% in all patients) and physiologic measures (sig- nificant reduction in pressure gradient), mean early poststent duplex scanning in 13 patients revealed SMA velocities ranging from 279 to 416 cm/s, with a mean posttreatment SMA PSV of 336 cm/s. Based on these early data, the authors concluded that SMA duplex velocity criteria developed for native vessels will likely overestimate the prevalence of recurrent or residual disease after stenting. This is important to keep in mind when the results are interpreted, as standard velocity thresholds may need to be adjust- ed. More investigation will be required to confirm this observation, but this issue will be of increasing importance as percutaneous intervention for mesen- teric occlusive disease gains wider acceptance.
Duplex scanning is an ideal monitoring method for these stents. As with other tests, it is important to compare findings with the previous study to report whether there has been an improvement in peak sys- tolic velocity and whether the velocity increases in sequential follow-up studies.
