
Page 374 - Libro 2
P. 374
354
PART 5 — ABDOMINAL
Figure 23-8 Power Doppler image demonstrating normal cortical perfusion of the kidney. Note the homogeneous per- fusion of the renal cortex from the small interlobular arteries arising from the arcuate arteries, which course behind the renal pyramids parallel to the renal capsule.
The RI is angle independent, and angle correction is not needed. The formula is as follows:
(Peak systolic velocity end-diastolic velocity) __________________________________________
peak systolic velocity
In order to calculate the RI, it is critical to accu- rately measure end-diastolic velocity, which should be measured at the end of diastole right before the next systolic upstroke. It is important that the sonographer not mistake overlying venous flow, flow due to mirror artifact, or noise in the signal for true diastolic flow. By observing the amount of color in the interlobar arter- ies during diastole, the sonographer can subjectively
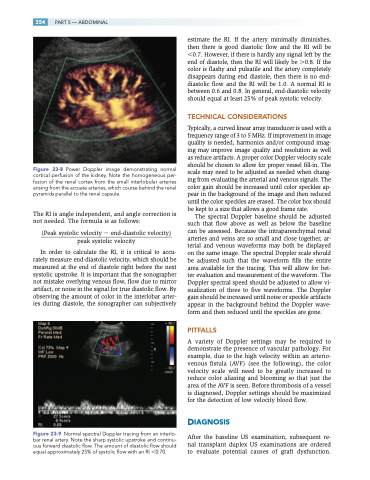
Figure 23-9 Normal spectral Doppler tracing from an interlo- bar renal artery. Note the sharp systolic upstroke and continu- ous forward diastolic flow. The amount of diastolic flow should equal approximately 25% of systolic flow with an RI 0.70.
estimate the RI. If the artery minimally diminishes, then there is good diastolic flow and the RI will be 0.7. However, if there is hardly any signal left by the end of diastole, then the RI will likely be 0.8. If the color is flashy and pulsatile and the artery completely disappears during end diastole, then there is no end- diastolic flow and the RI will be 1.0. A normal RI is between 0.6 and 0.8. In general, end-diastolic velocity should equal at least 25% of peak systolic velocity.
TECHNICAL CONSIDERATIONS
Typically, a curved linear array transducer is used with a frequency range of 3 to 5 MHz. If improvement in image quality is needed, harmonics and/or compound imag- ing may improve image quality and resolution as well as reduce artifacts. A proper color Doppler velocity scale should be chosen to allow for proper vessel fill-in. The scale may need to be adjusted as needed when chang- ing from evaluating the arterial and venous signals. The color gain should be increased until color speckles ap- pear in the background of the image and then reduced until the color speckles are erased. The color box should be kept to a size that allows a good frame rate.
The spectral Doppler baseline should be adjusted such that flow above as well as below the baseline can be assessed. Because the intraparenchymal renal arteries and veins are so small and close together, ar- terial and venous waveforms may both be displayed on the same image. The spectral Doppler scale should be adjusted such that the waveform fills the entire area available for the tracing. This will allow for bet- ter evaluation and measurement of the waveform. The Doppler spectral speed should be adjusted to allow vi- sualization of three to five waveforms. The Doppler gain should be increased until noise or speckle artifacts appear in the background behind the Doppler wave- form and then reduced until the speckles are gone.
PITFALLS
A variety of Doppler settings may be required to demonstrate the presence of vascular pathology. For example, due to the high velocity within an arterio- venous fistula (AVF) (see the following), the color velocity scale will need to be greatly increased to reduce color aliasing and blooming so that just the area of the AVF is seen. Before thrombosis of a vessel is diagnosed, Doppler settings should be maximized for the detection of low velocity blood flow.
DIAGNOSIS
After the baseline US examination, subsequent re- nal transplant duplex US examinations are ordered to evaluate potential causes of graft dysfunction.
