
Page 88 - Libro vascular I
P. 88
Chap-07.qxd 29~8~04 14:42 Page 79
OPTIMIZING THE SCAN
79
ABC
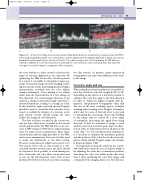
Figure 7.4 A: Poor color filling is seen in the posterior tibial artery distal to a long arterial occlusion because the PRF is set too high at 2500 Hz, and the color controls have not been optimized. B: The Doppler waveform confirms low-velocity damped flow with a peak systolic velocity of 10 cm/s. C: In order to improve the color flow display, the PRF has been lowered to 1000 Hz, the color write priority increased and the color sensitivity control increased. Note that only 79% color gain is needed in image C, compared to 85% in image A.
the color baseline to either extend or decrease the range of velocities displayed in one direction. By optimizing the PRF for the flow velocities present in a vessel, it is possible to investigate longer seg- ments of an artery using color flow imaging, reduc- ing the amount of time spent taking spectral Doppler measurements, provided that the color display remains unchanged. Color aliasing is an artifact rather than the representation of a true change in flow direction. If a vessel changes direction it can result in a change in insonation angle (and thus to detected frequency), leading to a change in color. In this situation, angle-corrected spectral Doppler should be used to record the flow velocities in the vessel, to confirm the absence of a stenosis, as the peak systolic velocity should remain the same despite the change in vessel direction.
The flow velocities recorded in the venous sys- tem are lower than those recorded in the arterial system and therefore the PRF will have to be low- ered. A PRF setting of 1000 Hz is a typical starting value for many venous examinations. Most ultra- sound systems link the high-pass filter to the PRF, and in most examinations there may be little need to make any adjustments to the filter setting. However, in situations in which there may be very low-velocity flow, such as that found in a sub- occluded internal carotid artery, the filter should be lowered as far as possible to avoid missing the flow. Conversely, the color filter can be increased to cut out the low-frequency noise, such as that produced by bowel movement seen when scanning
the iliac arteries. In practice, many experienced sonographers can cope with additional color noise in the image.
Color box angle and size
When using linear array transducers it is possible to steer the color box to the left or right by 20° to 25° depending on the system. It is therefore possible to optimize the color box angle to the flow direction in order to obtain the highest Doppler shift fre- quencies. Inexperienced sonographers often find this one of the most confusing aspects of duplex scanning when learning color Doppler techniques, and it may be a case of trial and error to get used to optimizing the color image. Areas of poor filling in the image may be caused by a poor angle of insonation, preventing the signal from being detected. It may be necessary to image a vessel with the color box steered in more than one direc- tion in order to demonstrate flow in all parts of the vessel (Fig. 7.5). For curvilinear array transducers, it is necessary to optimize the transducer position and the position of the color box in the sector dis- play to obtain suitable Doppler angles. An example is shown in Figure 9.8B.
It is important to keep the color box size reason- ably small and to keep the area of interest within it by adjusting the color box or transducer position. Increasing the color box width means that more time is spent producing the color flow image, and consequently the imaging frame rate will decrease.
