
Page 51 - Basic _ Clinical Pharmacology ( PDFDrive )
P. 51
CHAPTER 2 Drug Receptors & Pharmacodynamics 37
C. Quantal Dose-Effect Curves The quantal dose-effect curve is often characterized by stating
Graded dose-response curves of the sort described above have the median effective dose (ED 50 ), which is the dose at which
certain limitations in their application to clinical decision making. 50% of individuals exhibit the specified quantal effect. (Note that
For example, such curves may be impossible to construct if the the abbreviation ED 50 has a different meaning in this context from
pharmacologic response is an either-or (quantal) event, such as its meaning in relation to graded dose-effect curves, described in
prevention of convulsions, arrhythmia, or death. Furthermore, the previous text). Similarly, the dose required to produce a particular
clinical relevance of a quantitative dose-response relation in a single toxic effect in 50% of animals is called the median toxic dose
patient, no matter how precisely defined, may be limited in appli- (TD 50 ). If the toxic effect is death of the animal, a median lethal
cation to other patients, owing to the great potential variability dose (LD ) may be experimentally defined. Such values provide
50
among patients in severity of disease and responsiveness to drugs. a convenient way of comparing the potencies of drugs in experi-
Some of these difficulties may be avoided by determining the mental and clinical settings: Thus, if the ED s of two drugs for
50
dose of drug required to produce a specified magnitude of effect producing a specified quantal effect are 5 and 500 mg, respec-
in a large number of individual patients or experimental animals tively, then the first drug can be said to be 100 times more potent
and plotting the cumulative frequency distribution of responders than the second for that particular effect. Similarly, one can obtain
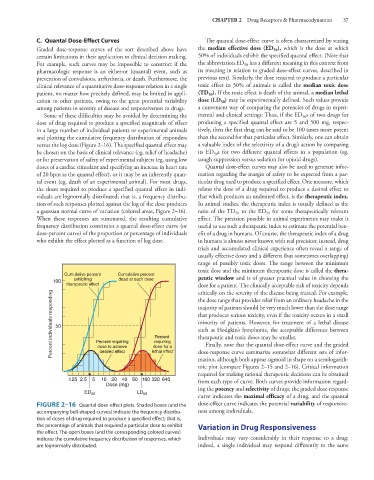
versus the log dose (Figure 2–16). The specified quantal effect may a valuable index of the selectivity of a drug’s action by comparing
be chosen on the basis of clinical relevance (eg, relief of headache) its ED 50 s for two different quantal effects in a population (eg,
or for preservation of safety of experimental subjects (eg, using low cough suppression versus sedation for opioid drugs).
doses of a cardiac stimulant and specifying an increase in heart rate Quantal dose-effect curves may also be used to generate infor-
of 20 bpm as the quantal effect), or it may be an inherently quan- mation regarding the margin of safety to be expected from a par-
tal event (eg, death of an experimental animal). For most drugs, ticular drug used to produce a specified effect. One measure, which
the doses required to produce a specified quantal effect in indi- relates the dose of a drug required to produce a desired effect to
viduals are lognormally distributed; that is, a frequency distribu- that which produces an undesired effect, is the therapeutic index.
tion of such responses plotted against the log of the dose produces In animal studies, the therapeutic index is usually defined as the
a gaussian normal curve of variation (colored areas, Figure 2–16). ratio of the TD 50 to the ED for some therapeutically relevant
50
When these responses are summated, the resulting cumulative effect. The precision possible in animal experiments may make it
frequency distribution constitutes a quantal dose-effect curve (or useful to use such a therapeutic index to estimate the potential ben-
dose-percent curve) of the proportion or percentage of individuals efit of a drug in humans. Of course, the therapeutic index of a drug
who exhibit the effect plotted as a function of log dose. in humans is almost never known with real precision; instead, drug
trials and accumulated clinical experience often reveal a range of
usually effective doses and a different (but sometimes overlapping)
range of possibly toxic doses. The range between the minimum
toxic dose and the minimum therapeutic dose is called the thera-
Cumulative percent Cumulative percent peutic window and is of greater practical value in choosing the
100 exhibiting dead at each dose
therapeutic effect dose for a patient. The clinically acceptable risk of toxicity depends
critically on the severity of the disease being treated. For example,
Percent individuals responding 50 Percent majority of patients should be very much lower than the dose range
the dose range that provides relief from an ordinary headache in the
that produces serious toxicity, even if the toxicity occurs in a small
minority of patients. However, for treatment of a lethal disease
such as Hodgkin’s lymphoma, the acceptable difference between
therapeutic and toxic doses may be smaller.
requiring
Percent requiring
Finally, note that the quantal dose-effect curve and the graded
dose to achieve
dose for a
dose-response curve summarize somewhat different sets of infor-
lethal effect
desired effect
mation, although both appear sigmoid in shape on a semilogarith-
mic plot (compare Figures 2–15 and 2–16). Critical information
required for making rational therapeutic decisions can be obtained
1.25 2.5 5 10 20 40 80 160 320 640 from each type of curve. Both curves provide information regard-
Dose (mg) ing the potency and selectivity of drugs; the graded dose-response
ED 50 LD 50
curve indicates the maximal efficacy of a drug, and the quantal
FIGURE 2–16 Quantal dose-effect plots. Shaded boxes (and the dose-effect curve indicates the potential variability of responsive-
accompanying bell-shaped curves) indicate the frequency distribu- ness among individuals.
tion of doses of drug required to produce a specified effect; that is,
the percentage of animals that required a particular dose to exhibit Variation in Drug Responsiveness
the effect. The open boxes (and the corresponding colored curves)
indicate the cumulative frequency distribution of responses, which Individuals may vary considerably in their response to a drug;
are lognormally distributed. indeed, a single individual may respond differently to the same