
Page 50 - Basic _ Clinical Pharmacology ( PDFDrive )
P. 50
36 SECTION I Basic Principles
trials, and there are preclinical efforts under way directed at devel-
oping inhibitors of specific G proteins.
A
C
RELATION BETWEEN DRUG DOSE &
CLINICAL RESPONSE D
In this chapter, we have dealt with receptors as molecules and Response
shown how receptors can quantitatively account for the relation B
between dose or concentration of a drug and pharmacologic
responses, at least in an idealized system. When faced with a
patient who needs treatment, the prescriber must make a choice
among a variety of possible drugs and devise a dosage regimen
that is likely to produce maximal benefit and minimal toxic-
ity. To make rational therapeutic decisions, the prescriber must
understand how drug-receptor interactions underlie the relations Log drug dose
between dose and response in patients, the nature and causes of
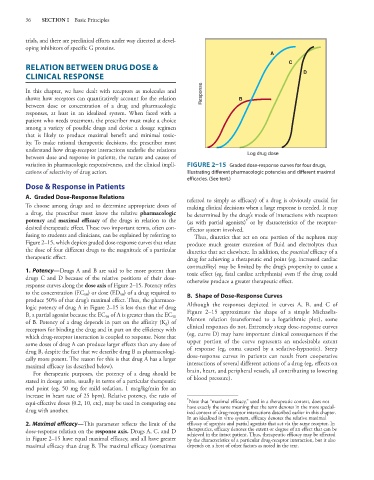
variation in pharmacologic responsiveness, and the clinical impli- FIGURE 2–15 Graded dose-response curves for four drugs,
cations of selectivity of drug action. illustrating different pharmacologic potencies and different maximal
efficacies. (See text.)
Dose & Response in Patients
A. Graded Dose-Response Relations referred to simply as efficacy) of a drug is obviously crucial for
To choose among drugs and to determine appropriate doses of making clinical decisions when a large response is needed. It may
a drug, the prescriber must know the relative pharmacologic be determined by the drug’s mode of interactions with receptors
potency and maximal efficacy of the drugs in relation to the (as with partial agonists) or by characteristics of the receptor-
*
desired therapeutic effect. These two important terms, often con- effector system involved.
fusing to students and clinicians, can be explained by referring to Thus, diuretics that act on one portion of the nephron may
Figure 2–15, which depicts graded dose-response curves that relate produce much greater excretion of fluid and electrolytes than
the dose of four different drugs to the magnitude of a particular diuretics that act elsewhere. In addition, the practical efficacy of a
therapeutic effect. drug for achieving a therapeutic end point (eg, increased cardiac
contractility) may be limited by the drug’s propensity to cause a
1. Potency—Drugs A and B are said to be more potent than toxic effect (eg, fatal cardiac arrhythmia) even if the drug could
drugs C and D because of the relative positions of their dose- otherwise produce a greater therapeutic effect.
response curves along the dose axis of Figure 2–15. Potency refers
to the concentration (EC ) or dose (ED ) of a drug required to B. Shape of Dose-Response Curves
50
50
produce 50% of that drug’s maximal effect. Thus, the pharmaco-
logic potency of drug A in Figure 2–15 is less than that of drug Although the responses depicted in curves A, B, and C of
B, a partial agonist because the EC of A is greater than the EC Figure 2–15 approximate the shape of a simple Michaelis-
50
50
of B. Potency of a drug depends in part on the affinity (K ) of Menten relation (transformed to a logarithmic plot), some
d
receptors for binding the drug and in part on the efficiency with clinical responses do not. Extremely steep dose-response curves
which drug-receptor interaction is coupled to response. Note that (eg, curve D) may have important clinical consequences if the
some doses of drug A can produce larger effects than any dose of upper portion of the curve represents an undesirable extent
drug B, despite the fact that we describe drug B as pharmacologi- of response (eg, coma caused by a sedative-hypnotic). Steep
cally more potent. The reason for this is that drug A has a larger dose-response curves in patients can result from cooperative
maximal efficacy (as described below). interactions of several different actions of a drug (eg, effects on
For therapeutic purposes, the potency of a drug should be brain, heart, and peripheral vessels, all contributing to lowering
stated in dosage units, usually in terms of a particular therapeutic of blood pressure).
end point (eg, 50 mg for mild sedation, 1 mcg/kg/min for an
increase in heart rate of 25 bpm). Relative potency, the ratio of *
Note that “maximal efficacy,” used in a therapeutic context, does not
equi-effective doses (0.2, 10, etc), may be used in comparing one have exactly the same meaning that the term denotes in the more special-
drug with another. ized context of drug-receptor interactions described earlier in this chapter.
In an idealized in vitro system, efficacy denotes the relative maximal
2. Maximal efficacy—This parameter reflects the limit of the efficacy of agonists and partial agonists that act via the same receptor. In
dose-response relation on the response axis. Drugs A, C, and D therapeutics, efficacy denotes the extent or degree of an effect that can be
achieved in the intact patient. Thus, therapeutic efficacy may be affected
in Figure 2–15 have equal maximal efficacy, and all have greater by the characteristics of a particular drug-receptor interaction, but it also
maximal efficacy than drug B. The maximal efficacy (sometimes depends on a host of other factors as noted in the text.