Page 18 - Las Vegas LVQR Market Research Report Q1 2024
P. 18

Retail
                              Las Vegas  24Q1                         Key Takeaways
                                                                         Retail vacancy decreased to 4.2% this quarter
                                                                         Net absorption was 146,168 SF
                                                                         The asking rate increased to $1.66 psf NNN


                        YOY                          YOY             Under      YOY            Overall Asking    YOY
           Vacancy Rate              Net Absorption               Construction               Lease Rates (NNN)
            4.2%      FORECAST        146K SF      FORECAST       158K SF     FORECAST        $1.66/ SF        FORECAST


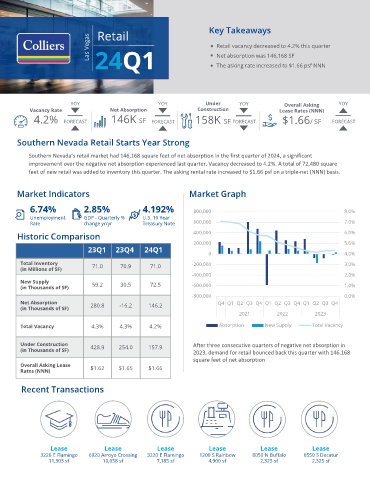
       Southern Nevada Retail Starts Year Strong


           Southern Nevada’s retail market had 146,168 square feet of net absorption in the first quarter of 2024, a significant
           improvement over the negative net absorption experienced last quarter. Vacancy decreased to 4.2%. A total of 72,480 square
           feet of new retail was added to inventory this quarter. The asking rental rate increased to $1.66 psf on a triple-net (NNN) basis.


       Market Indicators                                        Market Graph

           6.74%             2.85%              4.192%           800,000                                           8.0%
           Unemployment      GDP - Quarterly %   U.S. 10 Year
           Rate              change yr/yr       Treasury Note    600,000                                           7.0%

       Historic Comparison                                       400,000                                           6.0%
                                                                 200,000                                           5.0%
                              23Q1     23Q4      24Q1
                                                                      0                                            4.0%
        Total Inventory                                          -200,000                                          3.0%
        (in Millions of SF)     71.0     70.9      71.0
                                                                 -400,000                                          2.0%
        New Supply              59.2     30.5      72.5
        (in Thousands of SF)                                     -600,000                                          1.0%
                                                                 -800,000                                          0.0%
        Net Absorption         280.8     -16.2    146.2                  Q4 Q1 Q2 Q3 Q4 Q1 Q2 Q3 Q4 Q1 Q2 Q3 Q4
        (in Thousands of SF)
                                                                                2021         2022        2023

        Total Vacancy          4.3%      4.3%     4.2%                   Absorption      New Supply     Total Vacancy

        Under Construction     428.9    254.0     157.9          After three consecutive quarters of negative net absorption in
        (in Thousands of SF)                                     2023, demand for retail bounced back this quarter with 146,168
                                                                 square feet of net absorption
        Overall Asking Lease
        Rates (NNN)            $1.62    $1.65     $1.66

        Recent Transactions


                  Lease             Lease            Lease            Lease            Lease            Lease
        Colliers | Salt Lake County| 21Q1 | Office Report
              3220 E Flamingo  6920 Arroyo Crossing  3220 E Flamingo  1200 S Rainbow  8050 N Buffalo  6550 S Decatur
                 11,303 sf         10,058 sf         7,185 sf         4,900 sf         2,325 sf         2,325 sf
   13   14   15   16   17   18   19   20   21   22   23