
Page 19 - Las Vegas LVQR Market Research Report Q1 2024
P. 19
Colliers 2
Retail
Las Vegas 24Q1
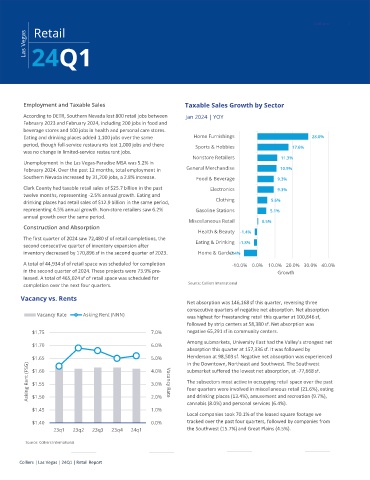
Employment and Taxable Sales Taxable Sales Growth by Sector
According to DETR, Southern Nevada lost 800 retail jobs between Jan 2024 | YOY
February 2023 and February 2024, including 200 jobs in food and
beverage stores and 100 jobs in health and personal care stores.
Eating and drinking places added 1,100 jobs over the same Home Furnishings 28.8%
period, though full-service restaurants lost 1,000 jobs and there Sports & Hobbies 17.6%
was no change in limited-service restaurant jobs.
Nonstore Retailers 11.3%
Unemployment in the Las Vegas-Paradise MSA was 5.2% in
General Merchandise 10.9%
February 2024. Over the past 12 months, total employment in
Southern Nevada increased by 31,200 jobs, a 2.8% increase. Food & Beverage 9.3%
Clark County had taxable retail sales of $25.7 billion in the past Electronics 9.3%
twelve months, representing -2.5% annual growth. Eating and Clothing
drinking places had retail sales of $12.9 billion in the same period, 5.6%
representing 4.5% annual growth. Non-store retailers saw 6.2% Gasoline Stations 5.1%
annual growth over the same period.
Miscellaneous Retail 0.5%
Construction and Absorption
Health & Beauty -1.4%
The first quarter of 2024 saw 72,480 sf of retail completions, the Eating & Drinking -1.8%
second consecutive quarter of inventory expansion after
inventory decreased by 170,896 sf in the second quarter of 2023. Home & Garden
-7.4%
A total of 44,934 sf of retail space was scheduled for completion -10.0% 0.0% 10.0% 20.0% 30.0% 40.0%
in the second quarter of 2024. These projects were 73.9% pre- Growth
leased. A total of 465,024 sf of retail space was scheduled for
Source: Colliers International
completion over the next four quarters.
Vacancy vs. Rents
Net absorption was 146,168 sf this quarter, reversing three
consecutive quarters of negative net absorption. Net absorption
Vacancy Rate Asking Rent (NNN)
was highest for freestanding retail this quarter at 100,846 sf,
followed by strip centers at 58,380 sf. Net absorption was
$1.75 7.0% negative 65,291 sf in community centers.
$1.70 6.0% Among submarkets, University East had the Valley’s strongest net
absorption this quarter at 157,336 sf. It was followed by
$1.65 5.0% Henderson at 98,503 sf. Negative net absorption was experienced
in the Downtown, Northeast and Southwest. The Southwest
Asking Rent (FSG) $1.60 4.0% Vacancy Rate submarket suffered the lowest net absorption, at -77,668 sf.
The subsectors most active in occupying retail space over the past
3.0%
$1.55
four quarters were involved in miscellaneous retail (21.6%), eating
$1.50
2.0%
and drinking places (13.4%), amusement and recreation (9.7%),
cannabis (8.0%) and personal services (6.4%).
$1.45 1.0%
Local companies took 70.1% of the leased square footage we
$1.40 0.0% tracked over the past four quarters, followed by companies from
23q1 23q2 23q3 23q4 24q1 the Southwest (15.7%) and Great Plains (4.5%).
Source: Colliers International
Colliers | Las Vegas | 24Q1 | Retail Report