
Page 560 - Microeconomics, Fourth Edition
P. 560
c13marketstructureandcompetition.qxd 7/30/10 10:44 AM Page 534
534 CHAPTER 13 MARKET STRUCTURE AND COMPETITION
knowledge of each other’s plans (without spying on each other). Once both firms
select their output, the market price instantly adjusts to clear the market. That is, given
the firms’ output choices, the market price becomes the price at which consumers are
willing to buy the firms’ combined output.
Each firm’s output choice depends on the market price, but the market price de-
pends on the combined output of the two firms—that is, the market price isn’t known
until both firms have made their output choice. Therefore, each firm will make the
output choice that maximizes its profit based on its expectation of the other firm’s out-
put choice. Thus, Samsung will choose the level of production that maximizes its
profits, given what it thinks LG’s output will be, and LG will choose the level of pro-
duction that maximizes its profits, given what output it thinks Samsung will produce.
In the Cournot model, firms thus act as quantity takers.
Figure 13.1(a) shows Samsung’s output-choice problem. Suppose that Samsung
expects LG to produce 50 units of output. Then, the relationship between the market
residual demand curve price and Samsung’s output is given by the residual demand curve D . A residual
50
In a Cournot model, the demand curve traces out the relationship between the market price and a firm’s quan-
curve that traces out the tity when the other firm sells a fixed amount of output (50 units, in this case). The
relationship between the residual demand curve D is the market demand curve (D ) shifted leftward by an
50
M
market price and a firm’s amount equal to LG’s output of 50. This ensures that when Samsung’s output is added
quantity when rival firms
hold their outputs fixed. to LG’s output of 50, the price along the residual demand curve D 50 equals the price
along the market demand curve D when we combine the two firms’ outputs. For ex-
M
ample, when LG produces 50 and Samsung produces 30, the price along the residual
demand curve is $20, which is also the price along the market demand curve D when
M
total output equals 80. MR 50 is the marginal revenue curve associated with D . It
50
bears the same relationship to the residual demand curve that a monopolist’s marginal
revenue curve bears to a market demand curve.
Price (dollars per unit) MR 50 50 units Price (dollars per unit) 20 units
$20
$10
$10
0 20 30 D 50 80 D M MC $20 0 MR 20 35 D 20 D M MC
Quantity (units per year) Quantity (units per year)
(a) Samsung’s profit-maximization problem (b) Samsung’s profit-maximization problem
when LG produces 50 when LG produces 20
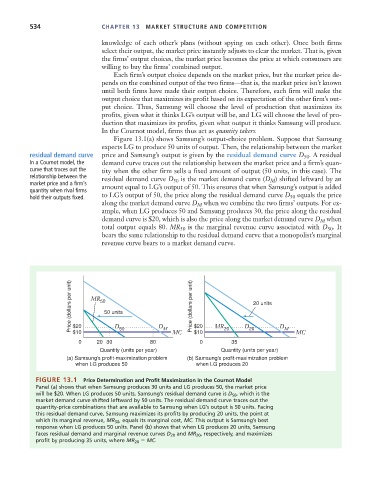
FIGURE 13.1 Price Determination and Profit Maximization in the Cournot Model
Panel (a) shows that when Samsung produces 30 units and LG produces 50, the market price
will be $20. When LG produces 50 units, Samsung’s residual demand curve is D 50 , which is the
market demand curve shifted leftward by 50 units. The residual demand curve traces out the
quantity-price combinations that are available to Samsung when LG’s output is 50 units. Facing
this residual demand curve, Samsung maximizes its profits by producing 20 units, the point at
which its marginal revenue, MR 50 , equals its marginal cost, MC. This output is Samsung’s best
response when LG produces 50 units. Panel (b) shows that when LG produces 20 units, Samsung
faces residual demand and marginal revenue curves D 20 and MR 20 , respectively, and maximizes
profit by producing 35 units, where MR 20 MC.