
Page 564 - Microeconomics, Fourth Edition
P. 564
c13marketstructureandcompetition.qxd 7/30/10 1:33 PM Page 538
538 CHAPTER 13 MARKET STRUCTURE AND COMPETITION
APPLICA TION 13.2
Corn Syrup Capacity Expansion culate a Cournot equilibrium for the corn wet-milling
industry. In this equilibrium, each firm’s capacity
Confirms Cournot choice was an optimal response to its expectations
about rival firms’ capacity choices, and the total in-
Michael Porter and Michael Spence’s study of the corn dustry capacity expansion that resulted from these
wet-milling industry is an application of the Cournot optimal choices matched the expectations on which
model to a real-world market. 10 Firms in the corn wet- firms based their decisions.
milling industry convert corn into corn starch and corn Based on their analysis, Porter and Spence con-
syrup. The industry had been a stable oligopoly until cluded that at an industry equilibrium, a moderate
the early 1970s, but in 1972, a major development oc- amount of additional capacity would be added to the
curred: The production of high-fructose corn syrup industry as a result of the commercialization of HFCS.
(HFCS) became commercially viable. HFCS can be used Table 13.3 shows the specific predictions of their
instead of sugar to sweeten products, such as soft model compared with the pattern of capacity expan-
drinks. With sugar prices expected to rise, a significant sion that actually occurred.
market for HFCS beckoned. Firms in the corn wet- Though not perfect, Porter and Spence’s calcu-
milling industry had to decide whether to add capac- lated equilibrium was close to the actual capacity
ity to meet the expected demand. expansion in the industry, particularly in 1973 and 1974.
Porter and Spence studied this capacity expansion Their research suggests that the Cournot model, when
process by constructing a model of competitive behavior adapted to specific industry conditions, can accurately
based on an in-depth study of the 11 major competi- describe the dynamics of capacity expansion in a
tors in the industry. They then used this model to cal- homogeneous-product oligopoly.
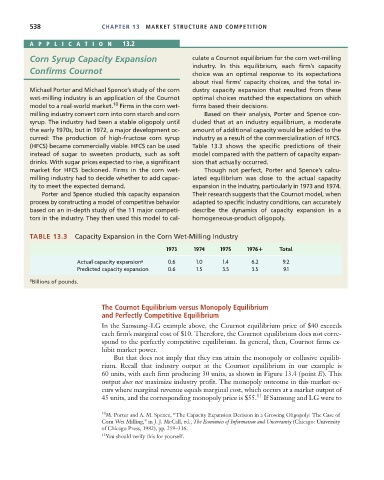
TABLE 13.3 Capacity Expansion in the Corn Wet-Milling Industry
1973 1974 1975 1976 Total
Actual capacity expansion a 0.6 1.0 1.4 6.2 9.2
Predicted capacity expansion 0.6 1.5 3.5 3.5 9.1
a
Billions of pounds.
The Cournot Equilibrium versus Monopoly Equilibrium
and Perfectly Competitive Equilibrium
In the Samsung–LG example above, the Cournot equilibrium price of $40 exceeds
each firm’s marginal cost of $10. Therefore, the Cournot equilibrium does not corre-
spond to the perfectly competitive equilibrium. In general, then, Cournot firms ex-
hibit market power.
But that does not imply that they can attain the monopoly or collusive equilib-
rium. Recall that industry output at the Cournot equilibrium in our example is
60 units, with each firm producing 30 units, as shown in Figure 13.4 (point E). This
output does not maximize industry profit. The monopoly outcome in this market oc-
curs where marginal revenue equals marginal cost, which occurs at a market output of
45 units, and the corresponding monopoly price is $55. 11 If Samsung and LG were to
10 M. Porter and A. M. Spence, “The Capacity Expansion Decision in a Growing Oligopoly: The Case of
Corn Wet Milling,” in J. J. McCall, ed., The Economics of Information and Uncertainty (Chicago: University
of Chicago Press, 1982), pp. 259–316.
11 You should verify this for yourself.