
Page 616 - Microeconomics, Fourth Edition
P. 616
c14gametheoryandstrategicbehavior.qxd 8/6/10 8:22 AM Page 590
590 CHAPTER 14 GAME THEORY AND STRATEGIC BEHAVIOR
industry observers estimated barely exceeded Delta’s Why did Philip Morris act as it did? In the early
marginal cost. Having been alerted to Morris’s move 1990s, Philip Morris had increased Marlboro’s market
on Saturday morning, B.A.T. had salespeople out sell- share at B.A.T.’s expense in other Central American
ing at the new price by Saturday afternoon. countries, such as Guatemala. Perhaps it expected
The ensuing price war lasted about two years. that it could replicate that success in Costa Rica. Still,
Cigarette sales increased 17 percent as a result of the had it anticipated B.A.T.’s quick response, Philip
lower prices, but market shares did not change. By Morris should have realized that its price cut would
the time the war ended in late 1994, Philip Morris’s not result in an increase in market share. Whatever
share of the Costa Rican market was unchanged, and the motivation for Philip Morris’s actions, this exam-
it was $8 million worse off than it had been before the ple highlights how quickly retaliation by competitors
war started. B.A.T. lost even more—$20 million—but it can nullify the advantages of a price cut. If firms un-
had preserved the market share of its Delta brand and derstand that and take the long view, their incentive
was able to maintain the same price gaps that had to use price as a competitive weapon to gain market
prevailed across market segments before the war. share will be blunted.
14.3 So far, we have studied games in which players make decisions simultaneously. In
SEQUENTIAL- many interesting games, however, one player can move before other players do. These
are called sequential-move games. In a sequential-move game, one player (the first
MOVE GAMES mover) takes an action before another player (the second mover). The second mover
AND observes the action taken by the first mover before it decides what action it should
STRATEGIC take. (The Stackelberg model of oligopoly discussed in Chapter 13 is a particular
example of a sequential-move game.) We shall see that the ability to move first in a
MOVES sequential-move game can sometimes have significant strategic value.
sequential-move
games Games in which ANALYZING SEQUENTIAL-MOVE GAMES
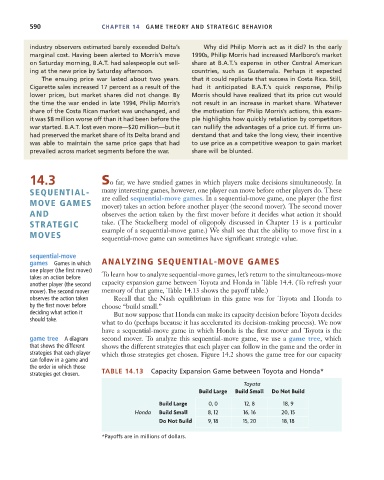
one player (the first mover) To learn how to analyze sequential-move games, let’s return to the simultaneous-move
takes an action before
another player (the second capacity expansion game between Toyota and Honda in Table 14.4. (To refresh your
mover). The second mover memory of that game, Table 14.13 shows the payoff table.)
observes the action taken Recall that the Nash equilibrium in this game was for Toyota and Honda to
by the first mover before choose “build small.”
deciding what action it But now suppose that Honda can make its capacity decision before Toyota decides
should take.
what to do (perhaps because it has accelerated its decision-making process). We now
have a sequential-move game in which Honda is the first mover and Toyota is the
game tree A diagram second mover. To analyze this sequential-move game, we use a game tree, which
that shows the different shows the different strategies that each player can follow in the game and the order in
strategies that each player which those strategies get chosen. Figure 14.2 shows the game tree for our capacity
can follow in a game and
the order in which those
strategies get chosen. TABLE 14.13 Capacity Expansion Game between Toyota and Honda*
Toyota
Build Large Build Small Do Not Build
Build Large 0, 0 12, 8 18, 9
Honda Build Small 8, 12 16, 16 20, 15
Do Not Build 9, 18 15, 20 18, 18
*Payoffs are in millions of dollars.