
Page 676 - Microeconomics, Fourth Edition
P. 676
c16GeneralEquilibriumTheory.qxd 8/16/10 9:13 PM Page 650
650 CHAPTER 16 GENERAL EQUILIBRIUM THEORY
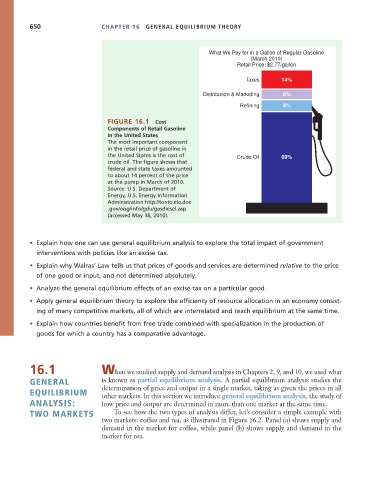
What We Pay for in a Gallon of Regular Gasoline
(March 2010)
Retail Price: $2.77/gallon
Taxes 14%
Distribution & Marketing 8%
Refining 9%
FIGURE 16.1 Cost
Components of Retail Gasoline
in the United States
The most important component
in the retail price of gasoline in
the United States is the cost of Crude Oil 69%
crude oil. The figure shows that
federal and state taxes amounted
to about 14 percent of the price
at the pump in March of 2010.
Source: U.S. Department of
Energy, U.S. Energy Information
Administration http://tonto.eia.doe
.gov/oog/info/gdu/gasdiesel.asp
(accessed May 18, 2010).
• Explain how one can use general equilibrium analysis to explore the total impact of government
interventions with policies like an excise tax.
• Explain why Walras’ Law tells us that prices of goods and services are determined relative to the price
of one good or input, and not determined absolutely.
• Analyze the general equilibrium effects of an excise tax on a particular good.
• Apply general equilibrium theory to explore the efficiency of resource allocation in an economy consist-
ing of many competitive markets, all of which are interrelated and reach equilibrium at the same time.
• Explain how countries benefit from free trade combined with specialization in the production of
goods for which a country has a comparative advantage.
16.1 When we studied supply and demand analysis in Chapters 2, 9, and 10, we used what
GENERAL is known as partial equilibrium analysis. A partial equilibrium analysis studies the
determination of price and output in a single market, taking as given the prices in all
EQUILIBRIUM other markets. In this section we introduce general equilibrium analysis, the study of
ANALYSIS: how price and output are determined in more than one market at the same time.
TWO MARKETS To see how the two types of analysis differ, let’s consider a simple example with
two markets: coffee and tea, as illustrated in Figure 16.2. Panel (a) shows supply and
demand in the market for coffee, while panel (b) shows supply and demand in the
market for tea.