
Page 680 - Microeconomics, Fourth Edition
P. 680
c16GeneralEquilibriumTheory.qxd 8/16/10 9:13 PM Page 654
654 CHAPTER 16 GENERAL EQUILIBRIUM THEORY
LEARNING-BY-DOING EXERCISE 16.1
S
D
E
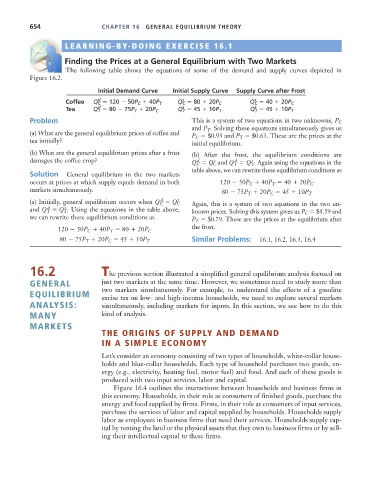
Finding the Prices at a General Equilibrium with Two Markets
The following table shows the equations of some of the demand and supply curves depicted in
Figure 16.2.
Initial Demand Curve Initial Supply Curve Supply Curve after Frost
d
s
s
Coffee Q C 120 50P C 40P T Q C 80 20P C Q C 40 20P C
s
s
d
Tea Q T 80 75P T 20P C Q T 45 10P T Q T 45 10P T
Problem This is a system of two equations in two unknowns, P C
and P T . Solving these equations simultaneously gives us
(a) What are the general equilibrium prices of coffee and P C $0.93 and P T $0.63. These are the prices at the
tea initially? initial equilibrium.
(b) What are the general equilibrium prices after a frost (b) After the frost, the equilibrium conditions are
damages the coffee crop? d s d s
Q C Q C and Q T Q T . Again using the equations in the
table above, we can rewrite these equilibrium conditions as
Solution General equilibrium in the two markets
occurs at prices at which supply equals demand in both 120 50P C 40P T 40 20P C
markets simultaneously.
80 75P T 20P C 45 10P T
d s
(a) Initially, general equilibrium occurs when Q C Q C Again, this is a system of two equations in the two un-
d
s
and Q T Q T . Using the equations in the table above, known prices. Solving this system gives us P C $1.59 and
we can rewrite these equilibrium conditions as P T $0.79. These are the prices at the equilibrium after
the frost.
120 50P C 40P T 80 20P C
Similar Problems: 16.1, 16.2, 16.3, 16.4
80 75P T 20P C 45 10P T
16.2 The previous section illustrated a simplified general equilibrium analysis focused on
GENERAL just two markets at the same time. However, we sometimes need to study more than
two markets simultaneously. For example, to understand the effects of a gasoline
EQUILIBRIUM excise tax on low- and high-income households, we need to explore several markets
ANALYSIS: simultaneously, including markets for inputs. In this section, we see how to do this
MANY kind of analysis.
MARKETS
THE ORIGINS OF SUPPLY AND DEMAND
IN A SIMPLE ECONOMY
Let’s consider an economy consisting of two types of households, white-collar house-
holds and blue-collar households. Each type of household purchases two goods, en-
ergy (e.g., electricity, heating fuel, motor fuel) and food. And each of these goods is
produced with two input services, labor and capital.
Figure 16.4 outlines the interactions between households and business firms in
this economy. Households, in their role as consumers of finished goods, purchase the
energy and food supplied by firms. Firms, in their role as consumers of input services,
purchase the services of labor and capital supplied by households. Households supply
labor as employees in business firms that need their services. Households supply cap-
ital by renting the land or the physical assets that they own to business firms or by sell-
ing their intellectual capital to these firms.