
Page 677 - Microeconomics, Fourth Edition
P. 677
c16GeneralEquilibriumTheory.qxd 8/16/10 9:13 PM Page 651
16.1 GENERAL EQUILIBRIUM ANALYSIS: TWO MARKETS 651
S' C S C S T
Price (dollars per pound) $1.59 Price (dollars per pound) $0.79
$1.50
$0.93
D' C $0.63 D'
D C D T T
0 Quantity (millions of pounds) 0 Quantity (millions of pounds)
(a) Coffee market (b) Tea market
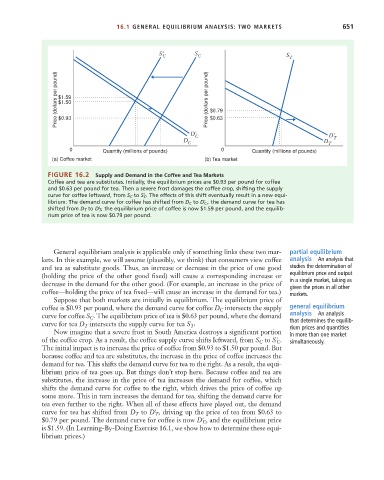
FIGURE 16.2 Supply and Demand in the Coffee and Tea Markets
Coffee and tea are substitutes. Initially, the equilibrium prices are $0.93 per pound for coffee
and $0.63 per pound for tea. Then a severe frost damages the coffee crop, shifting the supply
curve for coffee leftward, from S C to S¿ C . The effects of this shift eventually result in a new equi-
librium: The demand curve for coffee has shifted from D C to D¿ C , the demand curve for tea has
shifted from D T to D¿ T , the equilibrium price of coffee is now $1.59 per pound, and the equilib-
rium price of tea is now $0.79 per pound.
General equilibrium analysis is applicable only if something links these two mar- partial equilibrium
kets. In this example, we will assume (plausibly, we think) that consumers view coffee analysis An analysis that
and tea as substitute goods. Thus, an increase or decrease in the price of one good studies the determination of
equilibrium price and output
(holding the price of the other good fixed) will cause a corresponding increase or
in a single market, taking as
decrease in the demand for the other good. (For example, an increase in the price of
given the prices in all other
coffee—holding the price of tea fixed—will cause an increase in the demand for tea.) markets.
Suppose that both markets are initially in equilibrium. The equilibrium price of
intersects the supply general equilibrium
coffee is $0.93 per pound, where the demand curve for coffee D C
analysis An analysis
curve for coffee S . The equilibrium price of tea is $0.63 per pound, where the demand
C
curve for tea D intersects the supply curve for tea S . that determines the equilib-
T
T
rium prices and quantities
Now imagine that a severe frost in South America destroys a significant portion
in more than one market
of the coffee crop. As a result, the coffee supply curve shifts leftward, from S to S¿ . simultaneously.
C
C
The initial impact is to increase the price of coffee from $0.93 to $1.50 per pound. But
because coffee and tea are substitutes, the increase in the price of coffee increases the
demand for tea. This shifts the demand curve for tea to the right. As a result, the equi-
librium price of tea goes up. But things don’t stop here. Because coffee and tea are
substitutes, the increase in the price of tea increases the demand for coffee, which
shifts the demand curve for coffee to the right, which drives the price of coffee up
some more. This in turn increases the demand for tea, shifting the demand curve for
tea even further to the right. When all of these effects have played out, the demand
, driving up the price of tea from $0.63 to
T
curve for tea has shifted from D to D¿ T
$0.79 per pound. The demand curve for coffee is now D¿ , and the equilibrium price
C
is $1.59. (In Learning-By-Doing Exercise 16.1, we show how to determine these equi-
librium prices.)