
Page 685 - Microeconomics, Fourth Edition
P. 685
c16GeneralEquilibriumTheory.qxd 8/16/10 9:13 PM Page 659
16.2 GENERAL EQUILIBRIUM ANALYSIS: MANY MARKETS 659
Price of energy (dollars per unit) 0.8 S = MC x Price of food (dollars per unit) 0.8 S = MC y
$1
$1
x
y
0.6
0.6
0.4
0.4
0.2
0.2
0
10,000
5,000
5,000
10,000
15,000
20,000
15,000
Quantity of energy (units per year) 0 Quantity of food (units per year) 20,000
(a) Energy market (b) Food market
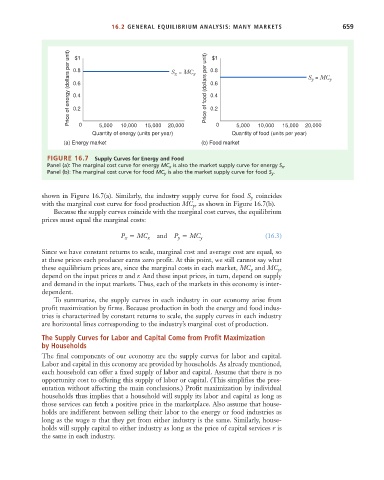
FIGURE 16.7 Supply Curves for Energy and Food
Panel (a): The marginal cost curve for energy MC x is also the market supply curve for energy S x .
Panel (b): The marginal cost curve for food MC y is also the market supply curve for food S y .
shown in Figure 16.7(a). Similarly, the industry supply curve for food S coincides
y
with the marginal cost curve for food production MC , as shown in Figure 16.7(b).
y
Because the supply curves coincide with the marginal cost curves, the equilibrium
prices must equal the marginal costs:
P MC x and P MC y (16.3)
x
y
Since we have constant returns to scale, marginal cost and average cost are equal, so
at these prices each producer earns zero profit. At this point, we still cannot say what
these equilibrium prices are, since the marginal costs in each market, MC and MC ,
y
x
depend on the input prices w and r. And these input prices, in turn, depend on supply
and demand in the input markets. Thus, each of the markets in this economy is inter-
dependent.
To summarize, the supply curves in each industry in our economy arise from
profit maximization by firms. Because production in both the energy and food indus-
tries is characterized by constant returns to scale, the supply curves in each industry
are horizontal lines corresponding to the industry’s marginal cost of production.
The Supply Curves for Labor and Capital Come from Profit Maximization
by Households
The final components of our economy are the supply curves for labor and capital.
Labor and capital in this economy are provided by households. As already mentioned,
each household can offer a fixed supply of labor and capital. Assume that there is no
opportunity cost to offering this supply of labor or capital. (This simplifies the pres-
entation without affecting the main conclusions.) Profit maximization by individual
households thus implies that a household will supply its labor and capital as long as
those services can fetch a positive price in the marketplace. Also assume that house-
holds are indifferent between selling their labor to the energy or food industries as
long as the wage w that they get from either industry is the same. Similarly, house-
holds will supply capital to either industry as long as the price of capital services r is
the same in each industry.