
Page 687 - Microeconomics, Fourth Edition
P. 687
c16GeneralEquilibriumTheory.qxd 8/16/10 9:13 PM Page 661
16.2 GENERAL EQUILIBRIUM ANALYSIS: MANY MARKETS 661
Price of energy (dollars per unit) $0.79 MC x x Price of food (dollars per unit) $0.70 MC = S y
= S
y
(w = $0.48,
(w = $0.48,
r = $1.00)
r = $1.00)
D
x
D
y
0
0
6202
Quantity of energy (units)
Quantity of food (units)
(a) Energy market S L (b) Food market 4943
S
Price of labor (dollars per unit) $0.48 Price of capital (dollars per unit) $1.00
K
K
X = 6202, Y = 4943)
X = 6202, Y = 4943)
0 7000 D L (r = $1.00, 0 5000 D (w = $0.48,
Quantity of labor (units) Quantity of capital (units)
(c) Labor market (d) Capital market
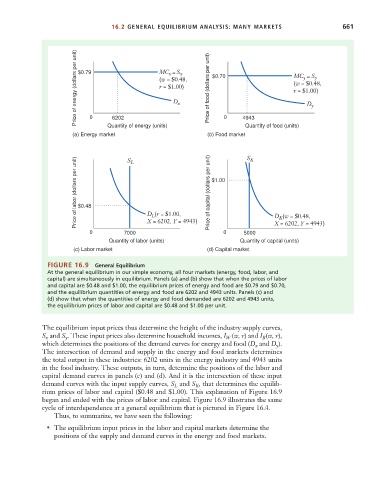
FIGURE 16.9 General Equilibrium
At the general equilibrium in our simple economy, all four markets (energy, food, labor, and
capital) are simultaneously in equilibrium. Panels (a) and (b) show that when the prices of labor
and capital are $0.48 and $1.00, the equilibrium prices of energy and food are $0.79 and $0.70,
and the equilibrium quantities of energy and food are 6202 and 4943 units. Panels (c) and
(d) show that when the quantities of energy and food demanded are 6202 and 4943 units,
the equilibrium prices of labor and capital are $0.48 and $1.00 per unit.
The equilibrium input prices thus determine the height of the industry supply curves,
S and S y . These input prices also determine household incomes, I W (w, r) and I B (w, r),
x
which determines the positions of the demand curves for energy and food (D x and D y ).
The intersection of demand and supply in the energy and food markets determines
the total output in these industries: 6202 units in the energy industry and 4943 units
in the food industry. These outputs, in turn, determine the positions of the labor and
capital demand curves in panels (c) and (d). And it is the intersection of these input
demand curves with the input supply curves, S L and S K , that determines the equilib-
rium prices of labor and capital ($0.48 and $1.00). This explanation of Figure 16.9
began and ended with the prices of labor and capital. Figure 16.9 illustrates the same
cycle of interdependence at a general equilibrium that is pictured in Figure 16.4.
Thus, to summarize, we have seen the following:
• The equilibrium input prices in the labor and capital markets determine the
positions of the supply and demand curves in the energy and food markets.