
Page 692 - Microeconomics, Fourth Edition
P. 692
c16GeneralEquilibriumTheory.qxd 8/16/10 9:13 PM Page 666
666 CHAPTER 16 GENERAL EQUILIBRIUM THEORY
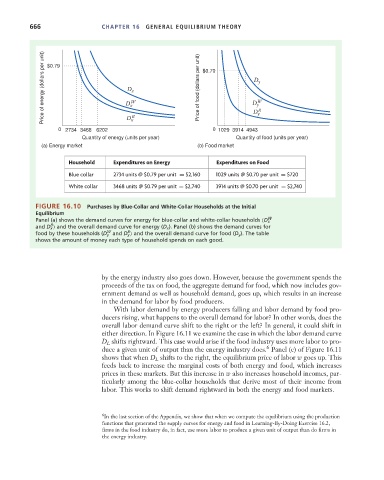
Price of energy (dollars per unit) $0.79 D x W Price of food (dollars per unit) $0.70 D y W
D y
D x
D y
0 2734 3468 6202 D x B 0 1029 3914 4943 B
Quantity of energy (units per year) Quantity of food (units per year)
(a) Energy market (b) Food market
Household Expenditures on Energy Expenditures on Food
Blue collar 2734 units @ $0.79 per unit = $2,160 1029 units @ $0.70 per unit = $720
White collar 3468 units @ $0.79 per unit = $2,740 3914 units @ $0.70 per unit = $2,740
FIGURE 16.10 Purchases by Blue-Collar and White-Collar Households at the Initial
Equilibrium
W
Panel (a) shows the demand curves for energy for blue-collar and white-collar households (D x
B
and D x ) and the overall demand curve for energy (D x ). Panel (b) shows the demand curves for
W B
food by these households (D y and D y ) and the overall demand curve for food (D y ). The table
shows the amount of money each type of household spends on each good.
by the energy industry also goes down. However, because the government spends the
proceeds of the tax on food, the aggregate demand for food, which now includes gov-
ernment demand as well as household demand, goes up, which results in an increase
in the demand for labor by food producers.
With labor demand by energy producers falling and labor demand by food pro-
ducers rising, what happens to the overall demand for labor? In other words, does the
overall labor demand curve shift to the right or the left? In general, it could shift in
either direction. In Figure 16.11 we examine the case in which the labor demand curve
D shifts rightward. This case would arise if the food industry uses more labor to pro-
L
6
duce a given unit of output than the energy industry does. Panel (c) of Figure 16.11
shows that when D shifts to the right, the equilibrium price of labor w goes up. This
L
feeds back to increase the marginal costs of both energy and food, which increases
prices in these markets. But this increase in w also increases household incomes, par-
ticularly among the blue-collar households that derive most of their income from
labor. This works to shift demand rightward in both the energy and food markets.
6 In the last section of the Appendix, we show that when we compute the equilibrium using the production
functions that generated the supply curves for energy and food in Learning-By-Doing Exercise 16.2,
firms in the food industry do, in fact, use more labor to produce a given unit of output than do firms in
the energy industry.