
Page 697 - Microeconomics, Fourth Edition
P. 697
c16GeneralEquilibriumTheory.qxd 8/16/10 9:13 PM Page 671
16.4 THE EFFICIENCY OF COMPETITIVE MARKETS 671
Energy consumed by blue-collar household
10 5 0
Total amount of food available Food consumed by white-collar household Food consumed by blue-collar household
0 1 5 G 9
10
Energy consumed by white-collar household
Total amount of energy available
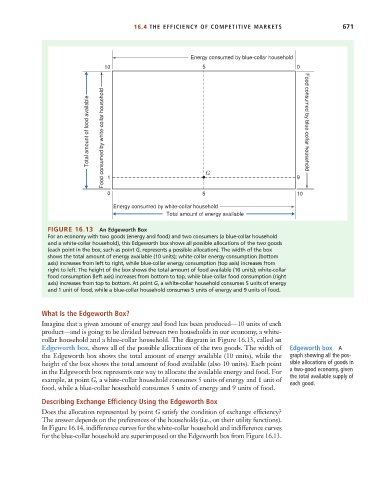
FIGURE 16.13 An Edgeworth Box
For an economy with two goods (energy and food) and two consumers (a blue-collar household
and a white-collar household), this Edgeworth box shows all possible allocations of the two goods
(each point in the box, such as point G, represents a possible allocation). The width of the box
shows the total amount of energy available (10 units); white-collar energy consumption (bottom
axis) increases from left to right, while blue-collar energy consumption (top axis) increases from
right to left. The height of the box shows the total amount of food available (10 units); white-collar
food consumption (left axis) increases from bottom to top, while blue-collar food consumption (right
axis) increases from top to bottom. At point G, a white-collar household consumes 5 units of energy
and 1 unit of food, while a blue-collar household consumes 5 units of energy and 9 units of food.
What Is the Edgeworth Box?
Imagine that a given amount of energy and food has been produced—10 units of each
product—and is going to be divided between two households in our economy, a white-
collar household and a blue-collar household. The diagram in Figure 16.13, called an
Edgeworth box, shows all of the possible allocations of the two goods. The width of Edgeworth box A
the Edgeworth box shows the total amount of energy available (10 units), while the graph showing all the pos-
height of the box shows the total amount of food available (also 10 units). Each point sible allocations of goods in
in the Edgeworth box represents one way to allocate the available energy and food. For a two-good economy, given
example, at point G, a white-collar household consumes 5 units of energy and 1 unit of the total available supply of
each good.
food, while a blue-collar household consumes 5 units of energy and 9 units of food.
Describing Exchange Efficiency Using the Edgeworth Box
Does the allocation represented by point G satisfy the condition of exchange efficiency?
The answer depends on the preferences of the households (i.e., on their utility functions).
In Figure 16.14, indifference curves for the white-collar household and indifference curves
for the blue-collar household are superimposed on the Edgeworth box from Figure 16.13.