
Page 699 - Microeconomics, Fourth Edition
P. 699
c16GeneralEquilibriumTheory.qxd 8/16/10 9:13 PM Page 673
16.4 THE EFFICIENCY OF COMPETITIVE MARKETS 673
exchanges (trades) among consumers that would benefit all consumers. (The inefficiency
corresponds to the fact that these potential benefits are not being realized.)
We have seen that point G does not represent an exchange efficient allocation
(nor, by the same argument, does point J or any other point where indifference curves
cross). Which points, then, do represent exchange efficient allocations? As you might
suspect, exchange efficient allocations are represented by points (such as point H and
point I) where indifference curves are tangent. Why? Because moving from such a
point would make at least one household worse off (i.e., would move at least one
household to a lower indifference curve). Thus, if the two households had traded as
described above to move from point G to point H, any further trade would hurt at
least one household. At an allocation that is economically efficient in exchange, there are no
potential trades among consumers that would benefit all consumers.
The Contract Curve
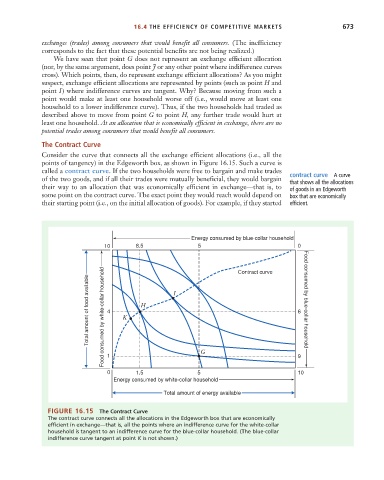
Consider the curve that connects all the exchange efficient allocations (i.e., all the
points of tangency) in the Edgeworth box, as shown in Figure 16.15. Such a curve is
called a contract curve. If the two households were free to bargain and make trades
of the two goods, and if all their trades were mutually beneficial, they would bargain contract curve A curve
that shows all the allocations
their way to an allocation that was economically efficient in exchange—that is, to of goods in an Edgeworth
some point on the contract curve. The exact point they would reach would depend on box that are economically
their starting point (i.e., on the initial allocation of goods). For example, if they started efficient.
Energy consumed by blue-collar household
10 8.5 5 Contract curve 0
Total amount of food available Food consumed by white-collar household 4 K H I 6 Food consumed by blue-collar household
0 1 1.5 5 G 9 10
Energy consumed by white-collar household
Total amount of energy available
FIGURE 16.15 The Contract Curve
The contract curve connects all the allocations in the Edgeworth box that are economically
efficient in exchange—that is, all the points where an indifference curve for the white-collar
household is tangent to an indifference curve for the blue-collar household. (The blue-collar
indifference curve tangent at point K is not shown.)