
Page 698 - Microeconomics, Fourth Edition
P. 698
c16GeneralEquilibriumTheory.qxd 8/16/10 9:13 PM Page 672
672 CHAPTER 16 GENERAL EQUILIBRIUM THEORY
Energy consumed by blue-collar household
10 8.5 5 0
White-collar
household
Direction
in which
Total amount of food available Food consumed by white-collar household 4 H I Blue-collar increases 6 Food consumed by blue-collar household
utility
household
1
10
0 1.5 J 5 G 9
Energy consumed by white-collar household
Total amount of energy available
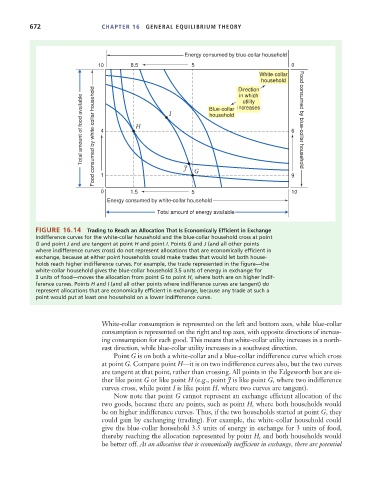
FIGURE 16.14 Trading to Reach an Allocation That Is Economically Efficient in Exchange
Indifference curves for the white-collar household and the blue-collar household cross at point
G and point J and are tangent at point H and point I. Points G and J (and all other points
where indifference curves cross) do not represent allocations that are economically efficient in
exchange, because at either point households could make trades that would let both house-
holds reach higher indifference curves. For example, the trade represented in the figure—the
white-collar household gives the blue-collar household 3.5 units of energy in exchange for
3 units of food—moves the allocation from point G to point H, where both are on higher indif-
ference curves. Points H and I (and all other points where indifference curves are tangent) do
represent allocations that are economically efficient in exchange, because any trade at such a
point would put at least one household on a lower indifference curve.
White-collar consumption is represented on the left and bottom axes, while blue-collar
consumption is represented on the right and top axes, with opposite directions of increas-
ing consumption for each good. This means that white-collar utility increases in a north-
east direction, while blue-collar utility increases in a southwest direction.
Point G is on both a white-collar and a blue-collar indifference curve which cross
at point G. Compare point H—it is on two indifference curves also, but the two curves
are tangent at that point, rather than crossing. All points in the Edgeworth box are ei-
ther like point G or like point H (e.g., point J is like point G, where two indifference
curves cross, while point I is like point H, where two curves are tangent).
Now note that point G cannot represent an exchange efficient allocation of the
two goods, because there are points, such as point H, where both households would
be on higher indifference curves. Thus, if the two households started at point G, they
could gain by exchanging (trading). For example, the white-collar household could
give the blue-collar household 3.5 units of energy in exchange for 3 units of food,
thereby reaching the allocation represented by point H, and both households would
be better off. At an allocation that is economically inefficient in exchange, there are potential