Page 693 - Microeconomics, Fourth Edition
P. 693

c16GeneralEquilibriumTheory.qxd  8/16/10  9:13 PM  Page 667


                                     16.3 GENERAL EQUILIBRIUM ANALYSIS: COMPARATIVE STATICS                     667


                            Price of energy (dollars per unit)  $1.02  S (excise tax)  Price of food (dollars per unit)  $0.74  S (excise tax)
                                                       x
                              0.99
                                                      S  + $0.20
                                                       x
                                                                                                y
                              0.79
                                                      S (no tax)
                                                       x
                                                                        0.70
                                                                                               S (no tax)
                                                                                                y
                                                         D (excise tax)
                                                           x
                                                                                                    D (excise tax)
                                                                                                      y
                                                         D (no tax)
                                                          x
                                                                                                   D (no tax)
                                0
                                       6202
                                       Quantity of energy (units)          0    4943 Quantity of food (units)  y
                           (a) Energy market                         (b) Food market
                                                    Price of labor (dollars per unit)  $0.55  S L  D (excise tax)


                                                      0.48
                                                                             L
                                                                           L

                                                         0         7000  D (no tax)
                                                               Quantity of labor (units)
                                                   (c) Labor market

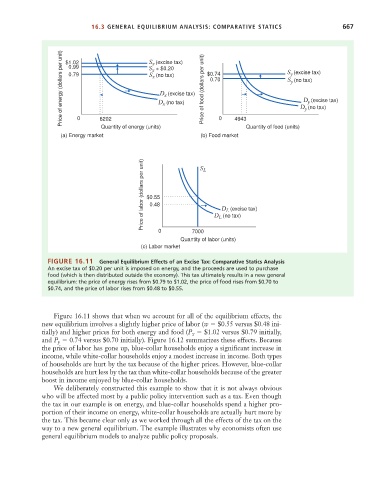
                       FIGURE 16.11    General Equilibrium Effects of an Excise Tax: Comparative Statics Analysis
                       An excise tax of $0.20 per unit is imposed on energy, and the proceeds are used to purchase
                       food (which is then distributed outside the economy). This tax ultimately results in a new general
                       equilibrium: the price of energy rises from $0.79 to $1.02, the price of food rises from $0.70 to
                       $0.74, and the price of labor rises from $0.48 to $0.55.


                         Figure 16.11 shows that when we account for all of the equilibrium effects, the
                      new equilibrium involves a slightly higher price of labor (w   $0.55 versus $0.48 ini-
                                                                      $1.02 versus $0.79 initially,
                      tially) and higher prices for both energy and food (P x
                      and P   0.74 versus $0.70 initially). Figure 16.12 summarizes these effects. Because
                           y
                      the price of labor has gone up, blue-collar households enjoy a significant increase in
                      income, while white-collar households enjoy a modest increase in income. Both types
                      of households are hurt by the tax because of the higher prices. However, blue-collar
                      households are hurt less by the tax than white-collar households because of the greater
                      boost in income enjoyed by blue-collar households.
                         We deliberately constructed this example to show that it is not always obvious
                      who will be affected most by a public policy intervention such as a tax. Even though
                      the tax in our example is on energy, and blue-collar households spend a higher pro-
                      portion of their income on energy, white-collar households are actually hurt more by
                      the tax. This became clear only as we worked through all the effects of the tax on the
                      way to a new general equilibrium. The example illustrates why economists often use
                      general equilibrium models to analyze public policy proposals.
   688   689   690   691   692   693   694   695   696   697   698