
Page 686 - Microeconomics, Fourth Edition
P. 686
c16GeneralEquilibriumTheory.qxd 8/16/10 9:13 PM Page 660
660 CHAPTER 16 GENERAL EQUILIBRIUM THEORY
$1.5 S L $1.5 S K
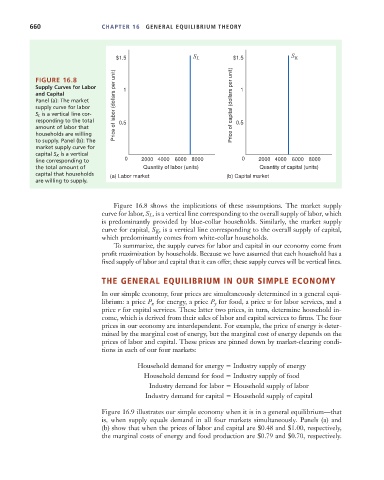
FIGURE 16.8
Supply Curves for Labor 1 1
and Capital
Panel (a): The market
supply curve for labor Price of labor (dollars per unit) Price of capital (dollars per unit)
S L is a vertical line cor-
responding to the total 0.5 0.5
amount of labor that
households are willing
to supply. Panel (b): The
market supply curve for
capital S K is a vertical
line corresponding to 0 2000 4000 6000 8000 0 2000 4000 6000 8000
the total amount of Quantity of labor (units) Quantity of capital (units)
capital that households (a) Labor market (b) Capital market
are willing to supply.
Figure 16.8 shows the implications of these assumptions. The market supply
curve for labor, S L , is a vertical line corresponding to the overall supply of labor, which
is predominantly provided by blue-collar households. Similarly, the market supply
curve for capital, S K , is a vertical line corresponding to the overall supply of capital,
which predominantly comes from white-collar households.
To summarize, the supply curves for labor and capital in our economy come from
profit maximization by households. Because we have assumed that each household has a
fixed supply of labor and capital that it can offer, these supply curves will be vertical lines.
THE GENERAL EQUILIBRIUM IN OUR SIMPLE ECONOMY
In our simple economy, four prices are simultaneously determined in a general equi-
librium: a price P x for energy, a price P y for food, a price w for labor services, and a
price r for capital services. These latter two prices, in turn, determine household in-
come, which is derived from their sales of labor and capital services to firms. The four
prices in our economy are interdependent. For example, the price of energy is deter-
mined by the marginal cost of energy, but the marginal cost of energy depends on the
prices of labor and capital. These prices are pinned down by market-clearing condi-
tions in each of our four markets:
Household demand for energy Industry supply of energy
Household demand for food Industry supply of food
Industry demand for labor Household supply of labor
Industry demand for capital Household supply of capital
Figure 16.9 illustrates our simple economy when it is in a general equilibrium—that
is, when supply equals demand in all four markets simultaneously. Panels (a) and
(b) show that when the prices of labor and capital are $0.48 and $1.00, respectively,
the marginal costs of energy and food production are $0.79 and $0.70, respectively.