
Page 453 - Economics
P. 453
CONFIRMING PAGES
CHAPTER 20
385
The Costs of Production
TABLE 20.2 Total-, Average-, and Marginal-Cost Schedules for an Individual Firm in the Short Run
Average-Cost Data Marginal Cost
(5) (6) (7)
Total-Cost Data
Average Average Average (8)
(1) (2) (3) (4) Fixed Variable Total Cost Marginal Cost
Total Total Total Total Cost (AFC) Cost (AVC) (ATC) (MC)
Product Fixed Variable Cost (TC) AFC TFC AVC TVC ATC TC change in TC
(Q) Cost (TFC) Cost (TVC) TC TFC TVC Q Q Q MC
change in Q
0 $100 $ 0 $ 100
$ 90
1 100 90 190 $100.00 $90.00 $190.00
80
2 100 170 270 50.00 85.00 135.00
70
3 100 240 340 33.33 80.00 113.33
60
4 100 300 400 25.00 75.00 100.00
70
5 100 370 470 20.00 74.00 94.00
80
6 100 450 550 16.67 75.00 91.67
90
7 100 540 640 14.29 77.14 91.43
110
8 100 650 750 12.50 81.25 93.75
130
9 100 780 880 11.11 86.67 97.78
150
10 100 930 1030 10.00 93.00 103.00
Total Cost Total Cost is the sum of fixed cost and AFC Average fixed cost (AFC) for any output level is
variable cost at each level of output: found by dividing total fixed cost (TFC) by that output
(Q). That is,
TC TFC TVC
_____
TC is shown in column 4 of Table 20.2. At zero units of AFC TFC
Q
output, total cost is equal to the firm’s fixed cost. Then for
each unit of the 10 units of production, total cost increases Because the total fixed cost is, by definition, the same re-
by the same amount as variable cost. gardless of output, AFC must decline as output increases.
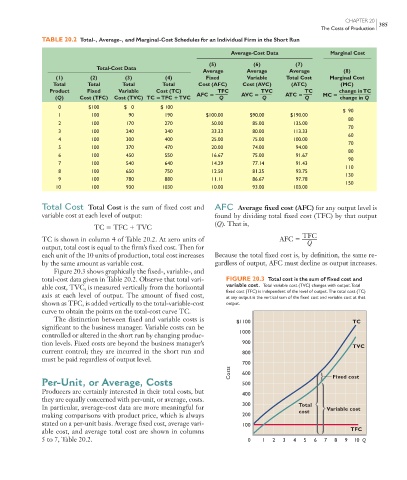
Figure 20.3 shows graphically the fixed-, variable-, and
total-cost data given in Table 20.2. Observe that total vari- FIGURE 20.3 Total cost is the sum of fixed cost and
able cost, TVC, is measured vertically from the horizontal variable cost. Total variable cost (TVC) changes with output. Total
fixed cost (TFC) is independent of the level of output. The total cost (TC)
axis at each level of output. The amount of fixed cost, at any output is the vertical sum of the fixed cost and variable cost at that
shown as TFC, is added vertically to the total-variable-cost output.
curve to obtain the points on the total-cost curve TC.
The distinction between fixed and variable costs is $1100 TC
significant to the business manager. Variable costs can be
1000
controlled or altered in the short run by changing produc-
tion levels. Fixed costs are beyond the business manager’s 900 TVC
current control; they are incurred in the short run and 800
must be paid regardless of output level.
700
Costs 600 Fixed cost
Per-Unit, or Average, Costs 500
Producers are certainly interested in their total costs, but
400
they are equally concerned with per-unit, or average, costs.
300 Total
In particular, average-cost data are more meaningful for Variable cost
cost
making comparisons with product price, which is always 200
stated on a per-unit basis. Average fixed cost, average vari- 100
able cost, and average total cost are shown in columns TFC
5 to 7, Table 20.2. 0 1 2 3 4 5 6 7 8 9 10 Q
mcc26632_ch20_378-398.indd 385 9/7/06 3:42:27 PM
9/7/06 3:42:27 PM
mcc26632_ch20_378-398.indd 385