
Page 454 - Economics
P. 454
CONFIRMING PAGES
PART SIX
386
Microeconomics of Product Markets
As output rises, the total fixed cost is spread over a larger fixed plant is understaffed, average variable cost is relatively
and larger output. When output is just 1 unit in Table 20.2, high. As output expands, however, greater specialization
TFC and AFC are the same at $100. But at 2 units of out- and better use of the firm’s capital equipment yield more
put, the total fixed cost of $100 becomes $50 of AFC or efficiency, and variable cost per unit of output declines. As
fixed cost per unit; then it becomes $33.33 per unit as $100 still more variable resources are added, a point is reached
is spread over 3 units, and $25 per unit when spread over where diminishing returns are incurred. The firm’s capital
4 units. This process is sometimes referred to as “spreading equipment is now staffed more intensively, and therefore
the overhead.” Figure 20.4 shows that AFC graphs as a each added input unit does not increase output by as much
continuously declining curve as total output is increased. as preceding inputs. This means that AVC eventually
increases.
AVC Average variable cost (AVC) for any output level You can verify the U or saucer shape of the AVC curve
is calculated by dividing total variable cost (TVC) by that by returning to Table 20.1. Assume the price of labor is $10
output (Q): per unit. By dividing average product (output per labor
unit) into $10 (price per labor unit), we determine the labor
TVC
AVC _____ cost per unit of output. Because we have assumed labor to
Q
be the only variable input, the labor cost per unit of output
As added variable resources increase output, AVC declines is the variable cost per unit of output, or AVC. When aver-
initially, reaches a minimum, and then increases again. A age product is initially low, AVC is high. As workers are
graph of AVC is a U-shaped or saucer-shaped curve, as added, average product rises and AVC falls. When average
shown in Figure 20.4. product is at its maximum, AVC is at its minimum. Then, as
Because total variable cost reflects the law of still more workers are added and average product declines,
diminishing returns, so must AVC, which is derived from AVC rises. The “hump” of the average-product curve is re-
total variable cost. Because marginal returns increase ini- flected in the saucer or U shape of the AVC curve. As you
tially, fewer and fewer additional variable resources are will soon see, the two are mirror images of each other.
needed to produce each of the first 4 units of output. As a
result, variable cost per unit declines. AVC hits a mini- ATC Average total cost (ATC) for any output level is
mum with the fifth unit of output, and beyond that point found by dividing total cost (TC) by that output (Q) or by
AVC rises as diminishing returns require more and more adding AFC and AVC at that output:
variable resources to produce each additional unit of
TFC
TC
TVC
____
output. ATC _____ _____ AFC AVC
In simpler terms, at very low levels of output produc- Q Q Q
tion is relatively inefficient and costly. Because the firm’s Graphically, ATC can be found by adding vertically the
AFC and AVC curves, as in Figure 20.4. Thus the vertical
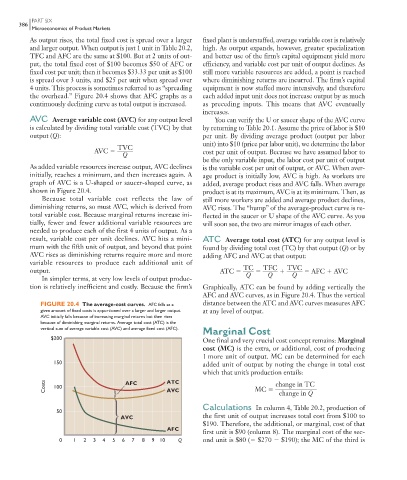
FIGURE 20.4 The average-cost curves. AFC falls as a distance between the ATC and AVC curves measures AFC
given amount of fixed costs is apportioned over a larger and larger output. at any level of output.
AVC initially falls because of increasing marginal returns but then rises
because of diminishing marginal returns. Average total cost (ATC) is the
vertical sum of average variable cost (AVC) and average fixed cost (AFC).
Marginal Cost
$200 One final and very crucial cost concept remains: Marginal
cost (MC) is the extra, or additional, cost of producing
1 more unit of output. MC can be determined for each
150 added unit of output by noting the change in total cost
which that unit’s production entails:
Costs 100 AFC ATC MC _____________
change in TC
AVC
change in Q
Calculations In column 4, Table 20.2, production of
50
AVC the first unit of output increases total cost from $100 to
$190. Therefore, the additional, or marginal, cost of that
AFC
first unit is $90 (column 8). The marginal cost of the sec-
0 1 2 3 4 5 6 7 8 9 10 Q ond unit is $80 ( $270 $190); the MC of the third is
9/7/06 3:42:27 PM
mcc26632_ch20_378-398.indd 386
mcc26632_ch20_378-398.indd 386 9/7/06 3:42:27 PM