
Page 456 - Economics
P. 456
CONFIRMING PAGES
PART SIX
388 keygraph
Microeconomics of Product Markets
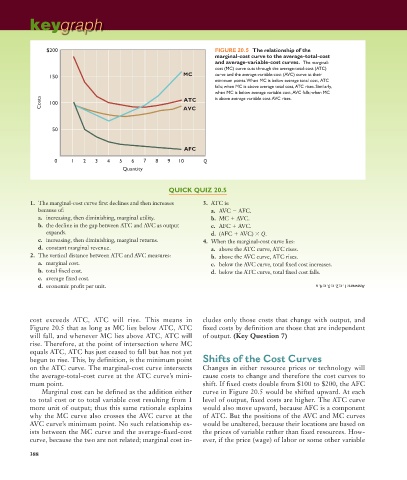
$200 FIGURE 20.5 The relationship of the
marginal-cost curve to the average-total-cost
and average-variable-cost curves. The marginal-
cost (MC) curve cuts through the average-total-cost (ATC)
MC curve and the average-variable-cost (AVC) curve at their
150
minimum points. When MC is below average total cost, ATC
falls; when MC is above average total cost, ATC rises. Similarly,
when MC is below average variable cost, AVC falls; when MC
Costs 100 AVC is above average variable cost AVC rises.
ATC
50
AFC
0 1 2 3 4 5 6 7 8 9 10 Q
Quantity
QUICK QUIZ 20.5
1. The marginal-cost curve first declines and then increases 3. ATC is:
because of: a. AVC AFC.
a. increasing, then diminishing, marginal utility. b. MC AVC.
b. the decline in the gap between ATC and AVC as output c. AFC AVC.
expands. d. (AFC AVC) Q.
c. increasing, then diminishing, marginal returns. 4. When the marginal-cost curve lies:
d. constant marginal revenue. a. above the ATC curve, ATC rises.
2. The vertical distance between ATC and AVC measures: b. above the AVC curve, ATC rises.
a. marginal cost. c. below the AVC curve, total fixed cost increases.
b. total fixed cost. d. below the ATC curve, total fixed cost falls.
c. average fixed cost.
d. economic profit per unit. Answers: 1. c; 2. c; 3. c; 4. a
cost exceeds ATC, ATC will rise. This means in cludes only those costs that change with output, and
Figure 20.5 that as long as MC lies below ATC, ATC fixed costs by definition are those that are independent
will fall, and whenever MC lies above ATC, ATC will of output. (Key Question 7)
rise. Therefore, at the point of intersection where MC
equals ATC, ATC has just ceased to fall but has not yet
begun to rise. This, by definition, is the minimum point Shifts of the Cost Curves
on the ATC curve. The marginal-cost curve intersects Changes in either resource prices or technology will
the average-total-cost curve at the ATC curve’s mini- cause costs to change and therefore the cost curves to
mum point. shift. If fixed costs double from $100 to $200, the AFC
Marginal cost can be defined as the addition either curve in Figure 20.5 would be shifted upward. At each
to total cost or to total variable cost resulting from 1 level of output, fixed costs are higher. The ATC curve
more unit of output; thus this same rationale explains would also move upward, because AFC is a component
why the MC curve also crosses the AVC curve at the of ATC. But the positions of the AVC and MC curves
AVC curve’s minimum point. No such relationship ex- would be unaltered, because their locations are based on
ists between the MC curve and the average-fixed-cost the prices of variable rather than fixed resources. How-
curve, because the two are not related; marginal cost in- ever, if the price (wage) of labor or some other variable
388
9/7/06 3:42:28 PM
mcc26632_ch20_378-398.indd 388 9/7/06 3:42:28 PM
mcc26632_ch20_378-398.indd 388