
Page 368 - Foundations of Marketing
P. 368
Pricing Concepts and Management | Chapter 12 335
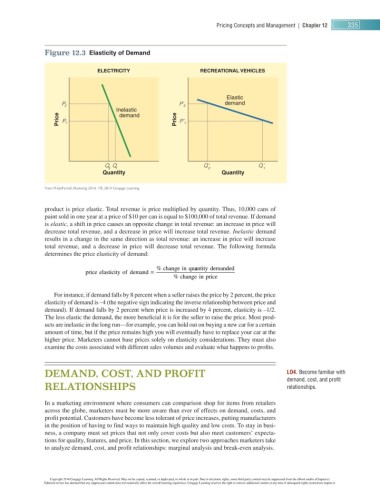
Figure 12.3 Elasticity of Demand
ELECTRICITY RECREATIONAL VEHICLES
Elastic
demand
P 2 P' 2
Inelastic
Price P 1 demand Price P' 1
Q Q Q' Q'
2 1 2 1
Quantity Quantity
From Pride/ Ferrell , Marketing 2014, 17E. 2014 Cengage Learning.
product is price elastic. Total revenue is price multiplied by quantity. Thus, 10,000 cans of
paint sold in one year at a price of $ 10 per can is equal to $ 100,000 of total revenue. If demand
is elastic, a shift in price causes an opposite change in total revenue: an increase in price will
decrease total revenue, and a decrease in price will increase total revenue. Inelastic demand
results in a change in the same direction as total revenue: an increase in price will increase
total revenue, and a decrease in price will decrease total revenue. The following formula
determines the price elasticity of demand:
price elasticity of demand = % change in qu a antity demanded
% change in price
For instance, if demand falls by 8 percent when a seller raises the price by 2 percent, the price
elasticity of demand is – 4 (the negative sign indicating the inverse relationship between price and
demand). If demand falls by 2 percent when price is increased by 4 percent, elasticity is – 1 / 2 .
The less elastic the demand, the more benefi cial it is for the seller to raise the price. Most prod-
ucts are inelastic in the long run—for example, you can hold out on buying a new car for a certain
amount of time, but if the price remains high you will eventually have to replace your car at the
higher price. Marketers cannot base prices solely on elasticity considerations. They must also
examine the costs associated with different sales volumes and evaluate what happens to profi ts.
DEMAND, COST, AND PROFIT LO 4 . Become familiar with
demand, cost, and profit
RELATIONSHIPS relationships.
In a marketing environment where consumers can comparison shop for items from retailers
across the globe, marketers must be more aware than ever of effects on demand, costs, and
profit potential. Customers have become less tolerant of price increases, putting manufacturers
in the position of having to find ways to maintain high quality and low costs. To stay in busi-
ness, a company must set prices that not only cover costs but also meet customers’ expecta-
tions for quality, features, and price. In this section, we explore two approaches marketers take
to analyze demand, cost, and profit relationships: marginal analysis and break-even analysis.
Copyright 2014 Cengage Learning. All Rights Reserved. May not be copied, scanned, or duplicated, in whole or in part. Due to electronic rights, some third party content may be suppressed from the eBook and/or eChapter(s).
Editorial review has deemed that any suppressed content does not materially affect the overall learning experience. Cengage Learning reserves the right to remove additional content at any time if subsequent rights restrictions require it.