
Page 371 - Foundations of Marketing
P. 371
338 Part 4 | Product and Price Decisions
fi rms face downward-sloping demand curves for their products. In other words, they must
lower their prices to sell additional units. This situation means that each additional unit of
product sold provides the fi rm with less revenue than the previous unit sold, which you can
see illustrated in Figure 12.5 . Marginal revenue decreases as price decreases and quantity
sold increases. Eventually, marginal revenue will reach zero, and the sale of additional units
actually causes the fi rm to lose money.
Before the fi rm can determine whether a unit will be profi table, it must calculate costs and
revenue, because profi t equals revenue minus cost. If MR is the increase in revenue generated
by the sale of a single additional unit of a product, and MC is the additional cost a single unit
adds to a fi rm, subtracting MR from MC will tells us whether the unit is profi table. Table 12.2
provides an example of the relationships between price, quantity sold, total revenue, marginal
revenue, marginal cost, and total cost. It indicates to a marketer the various combinations of
price and cost where maximum profi ts are possible. Notice that the total cost and the marginal
cost in Table 12.2 also appear in Table 12.1 .
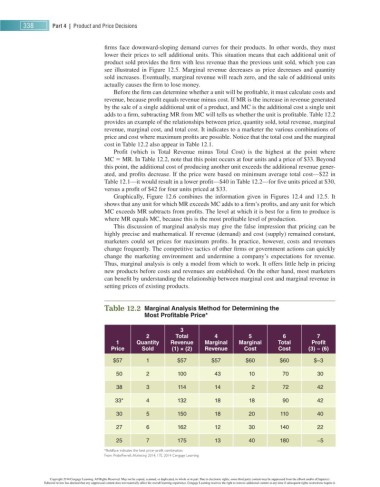
Profit (which is Total Revenue minus Total Cost) is the highest at the point where
MC = MR . In Table 12.2 , note that this point occurs at four units and a price of $ 33 . Beyond
this point, the additional cost of producing another unit exceeds the additional revenue gener-
ated, and profits decrease. If the price were based on minimum average total cost—$ 22 in
Table 12.1 —it would result in a lower profit—$ 40 in Table 12.2 —for five units priced at $ 30 ,
versus a profit of $ 42 for four units priced at $ 33 .
Graphically, Figure 12.6 combines the information given in Figures 12.4 and 12.5 . It
shows that any unit for which MR exceeds MC adds to a fi rm’s profi ts, and any unit for which
MC exceeds MR subtracts from profi ts. The level at which it is best for a fi rm to produce is
where MR equals MC, because this is the most profi table level of production.
This discussion of marginal analysis may give the false impression that pricing can be
highly precise and mathematical. If revenue (demand) and cost (supply) remained constant,
marketers could set prices for maximum profi ts. In practice, however, costs and revenues
change frequently. The competitive tactics of other fi rms or government actions can quickly
change the marketing environment and undermine a company’s expectations for revenue.
Thus, marginal analysis is only a model from which to work. It offers little help in pricing
new products before costs and revenues are established. On the other hand, most marketers
can benefi t by understanding the relationship between marginal cost and marginal revenue in
setting prices of existing products.
Table 12.2 Marginal Analysis Method for Determining the
Most Profi table Price *
3
2 Total 4 5 6 7
1 Quantity Revenue Marginal Marginal Total Profi t
Price Sold ( 1 ) × ( 2 ) Revenue Cost Cost ( 3 ) − ( 6 )
$ 57 1 $ 57 $ 57 $ 60 $ 60 $ − 3
50 2 100 43 10 70 30
38 3 114 14 2 72 42
33 * 4 132 18 18 90 42
30 5 150 18 20 110 40
27 6 162 12 30 140 22
25 7 175 13 40 180 − 5
*Boldface indicates the best price–profit combination.
From Pride/ Ferrell , Marketing 2014, 17E. 2014 Cengage Learning.
Copyright 2014 Cengage Learning. All Rights Reserved. May not be copied, scanned, or duplicated, in whole or in part. Due to electronic rights, some third party content may be suppressed from the eBook and/or eChapter(s).
Editorial review has deemed that any suppressed content does not materially affect the overall learning experience. Cengage Learning reserves the right to remove additional content at any time if subsequent rights restrictions require it.