
Page 370 - Foundations of Marketing
P. 370
Pricing Concepts and Management | Chapter 12 337
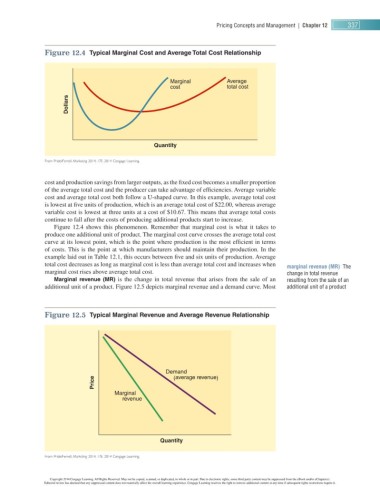
Figure 12.4 Typical Marginal Cost and Average Total Cost Relationship
Marginal Average
cost total cost
Dollars
Quantity
From Pride/ Ferrell , Marketing 2014, 17E. 2014 Cengage Learning.
cost and production savings from larger outputs, as the fi xed cost becomes a smaller proportion
of the average total cost and the producer can take advantage of effi ciencies. Average variable
cost and average total cost both follow a U-shaped curve. In this example, average total cost
is lowest at fi ve units of production, which is an average total cost of $ 22.00 , whereas average
variable cost is lowest at three units at a cost of $ 10.67 . This means that average total costs
continue to fall after the costs of producing additional products start to increase.
Figure 12.4 shows this phenomenon. Remember that marginal cost is what it takes to
produce one additional unit of product. The marginal cost curve crosses the average total cost
curve at its lowest point, which is the point where production is the most effi cient in terms
of costs. This is the point at which manufacturers should maintain their production. In the
example laid out in Table 12.1 , this occurs between fi ve and six units of production. Average
total cost decreases as long as marginal cost is less than average total cost and increases when marginal revenue (MR) The
marginal cost rises above average total cost. change in total revenue
Marginal revenue (MR) is the change in total revenue that arises from the sale of an resulting from the sale of an
additional unit of a product. Figure 12.5 depicts marginal revenue and a demand curve. Most additional unit of a product
Figure 12.5 Typical Marginal Revenue and Average Revenue Relationship
Demand
Price (average revenue)
Marginal
revenue
Quantity
From Pride/Ferrell, Marketing 2014, 17E. 2014 Cengage Learning.
Copyright 2014 Cengage Learning. All Rights Reserved. May not be copied, scanned, or duplicated, in whole or in part. Due to electronic rights, some third party content may be suppressed from the eBook and/or eChapter(s).
Editorial review has deemed that any suppressed content does not materially affect the overall learning experience. Cengage Learning reserves the right to remove additional content at any time if subsequent rights restrictions require it.