Page 424 - Business Principles and Management
P. 424

Chapter 15 • Business Financial Records


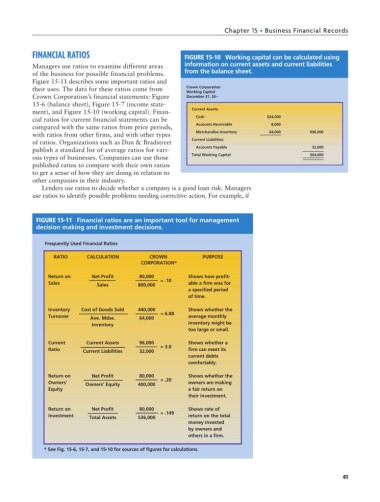
                        FINANCIAL RATIOS                                FIGURE 15-10 Working capital can be calculated using
                        Managers use ratios to examine different areas   information on current assets and current liabilities
                        of the business for possible financial problems.  from the balance sheet.
                        Figure 15-11 describes some important ratios and
                        their uses. The data for these ratios come from  Crown Corporation
                                                                        Working Capital
                        Crown Corporation’s financial statements: Figure  December 31, 20--
                        15-6 (balance sheet), Figure 15-7 (income state-
                        ment), and Figure 15-10 (working capital). Finan-  Current Assets:
                        cial ratios for current financial statements can be      Cash             $24,000
                        compared with the same ratios from prior periods,      Accounts Receivable  8,000
                        with ratios from other firms, and with other types      Merchandise Inventory  64,000  $96,000
                        of ratios. Organizations such as Dun & Bradstreet  Current Liabilities:
                        publish a standard list of average ratios for vari-      Accounts Payable               32,000
                        ous types of businesses. Companies can use those  Total Working Capital                $64,000
                        published ratios to compare with their own ratios
                        to get a sense of how they are doing in relation to
                        other companies in their industry.
                           Lenders use ratios to decide whether a company is a good loan risk. Managers
                        use ratios to identify possible problems needing corrective action. For example, if


                         FIGURE 15-11 Financial ratios are an important tool for management
                         decision making and investment decisions.


                            Frequently Used Financial Ratios
                               RATIO     CALCULATION         CROWN           PURPOSE
                                                           CORPORATION*

                             Return on     Net Profit     80,000         Shows how profit-
                                                                = .10
                             Sales          Sales        800,000         able a firm was for
                                                                         a specified period
                                                                         of time.
                             Inventory  Cost of Goods Sold  440,000      Shows whether the
                             Turnover     Ave. Mdse.      64,000  = 6.88  average monthly
                                           Inventory                     inventory might be
                                                                         too large or small.
                             Current     Current Assets   96,000         Shows whether a
                                                                = 3.0
                             Ratio                                       firm can meet its
                                        Current Liabilities  32,000
                                                                         current debts
                                                                         comfortably.
                             Return on     Net Profit     80,000         Shows whether the
                                                                = .20
                             Owners’     Owners’ Equity  400,000         owners are making
                             Equity                                      a fair return on
                                                                         their investment.
                             Return on     Net Profit     80,000         Shows rate of
                                                                = .149
                             Investment   Total Assets   536,000         return on the total
                                                                         money invested
                                                                         by owners and
                                                                         others in a firm.

                           * See Fig. 15-6, 15-7, and 15-10 for sources of figures for calculations.


                                                                                                                          411
   419   420   421   422   423   424   425   426   427   428   429