Page 419 - Business Principles and Management
P. 419

Unit 5


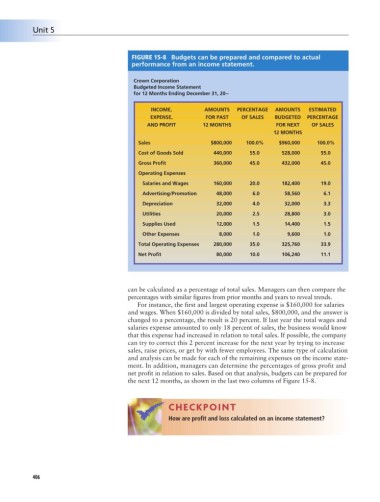
                                                 FIGURE 15-8 Budgets can be prepared and compared to actual
                                                 performance from an income statement.

                                                  Crown Corporation
                                                  Budgeted Income Statement
                                                  for 12 Months Ending December 31, 20--

                                                       INCOME,          AMOUNTS   PERCENTAGE  AMOUNTS    ESTIMATED
                                                       EXPENSE,         FOR PAST    OF SALES  BUDGETED  PERCENTAGE
                                                      AND PROFIT       12 MONTHS               FOR NEXT   OF SALES
                                                                                              12 MONTHS
                                                   Sales                  $800,000   100.0%    $960,000    100.0%
                                                   Cost of Goods Sold      440,000    55.0      528,000      55.0
                                                   Gross Profit            360,000    45.0      432,000      45.0
                                                   Operating Expenses
                                                      Salaries and Wages   160,000    20.0      182,400      19.0
                                                      Advertising/Promotion  48,000    6.0       58,560      6.1
                                                      Depreciation          32,000     4.0       32,000      3.3
                                                      Utilities             20,000     2.5       28,800      3.0
                                                      Supplies Used         12,000     1.5       14,400      1.5
                                                      Other Expenses         8,000     1.0        9,600      1.0
                                                   Total Operating Expenses  280,000  35.0      325,760      33.9
                                                   Net Profit               80,000    10.0      106,240      11.1


                                                can be calculated as a percentage of total sales. Managers can then compare the
                                                percentages with similar figures from prior months and years to reveal trends.
                                                   For instance, the first and largest operating expense is $160,000 for salaries
                                                and wages. When $160,000 is divided by total sales, $800,000, and the answer is
                                                changed to a percentage, the result is 20 percent. If last year the total wages and
                                                salaries expense amounted to only 18 percent of sales, the business would know
                                                that this expense had increased in relation to total sales. If possible, the company
                                                can try to correct this 2 percent increase for the next year by trying to increase
                                                sales, raise prices, or get by with fewer employees. The same type of calculation
                                                and analysis can be made for each of the remaining expenses on the income state-
                                                ment. In addition, managers can determine the percentages of gross profit and
                                                net profit in relation to sales. Based on that analysis, budgets can be prepared for
                                                the next 12 months, as shown in the last two columns of Figure 15-8.


                                                             CHECKPOINT

                                                             How are profit and loss calculated on an income statement?


                  406
   414   415   416   417   418   419   420   421   422   423   424