
Page 510 - Environment: The Science Behind the Stories
P. 510
early glacial cycles differ from the recent
cycles (see the black line in Figure 1).
CH 4 2 today (1820) In the recent cycles, glacial periods
Carbon dioxide (ppmv) 350 are brief, with a rapid rise and fall of
400
CO today (396)
are long, whereas interglacial periods
temperature. Interglacials thus appear
300
on the graph as tall thin spikes. In older
250
glacial cycles, the glacial and intergla-
cial periods are of more equal duration,
200
and the interglacials are not as warm.
700 This change in the nature of
glacial cycles had been noted before
600
by researchers working with oxygen
500 isotope data from the fossils of marine
400 organisms. But why cycles should dif-
800 Methane (ppbv)
4
fer before and after the 450,000-year
Temperature (˚C) –4 0 mark, no one knows.
Today polar scientists are search-
ing for a site that might provide an ice
core stretching back more than
–8
1 million years. At that time, data from
marine isotopes tell us that glacial
800,000 600,000 400,000 200,000 0
Years before present cycles switched from a periodicity of
roughly 41,000 years (conforming to
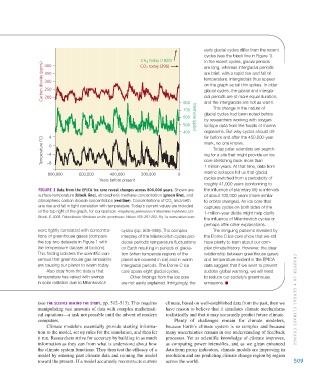
Figure 1 data from the ePica ice core reveal changes across 800,000 years. Shown are the influence of planetary tilt) to intervals
surface temperature (black line), atmospheric methane concentration (green line), and of about 100,000 years (more similar
atmospheric carbon dioxide concentration (red line). Concentrations of CO and meth- to orbital changes). An ice core that
2
ane rise and fall in tight correlation with temperature. Today’s current values are included captures cycles on both sides of the
at the top right of the graph, for comparison. Adapted by permission of Macmillan Publishers Ltd: 1-million-year divide might help clarify
Brook, E. 2008. Paleoclimate: Windows on the greenhouse. Nature 453: 291-292, Fig 1a. www.nature.com.
the influence of Milankovitch cycles or
perhaps offer other explanations.
were tightly correlated with concentra- cycles (pp. 505–506). The complex The intriguing patterns revealed by
tions of greenhouse gases (compare interplay of the Milankovitch cycles pro- the Dome C ice core show that we still
the top two datasets in Figure 1 with duces periodic temperature fluctuations have plenty to learn about our com-
the temperature dataset at bottom). on Earth resulting in periods of glacia- plex climate history. However, the clear
This finding bolsters the scientific con- tion (when temperate regions of the relationship between greenhouse gases
sensus that greenhouse gas emissions planet are covered in ice) and in warm and temperature evident in the EPICA
are causing our planet to warm today. interglacial periods. The Dome C ice data suggest that if we want to prevent
Also clear from the data is that core spans eight glacial cycles. sudden global warming, we will need
temperature has varied with swings Other findings from the ice core to reduce our society’s greenhouse
in solar radiation due to Milankovitch are not easily explained. Intriguingly, the emissions.
(see The Science behind The STory, pp. 512–513). This requires climate, based on well-established data from the past, then we CHAPTER 18 • Glob al Cli M aT e Chan G e
manipulating vast amounts of data with complex mathemati- have reason to believe that it simulates climate mechanisms
cal equations—a task not possible until the advent of modern realistically and that it may accurately predict future climate.
computers. Plenty of challenges remain for climate modelers,
Climate modelers essentially provide starting informa- because Earth’s climate system is so complex and because
tion to the model, set up rules for the simulation, and then let many uncertainties remain in our understanding of feedback
it run. Researchers strive for accuracy by building in as much processes. Yet as scientific knowledge of climate improves,
information as they can from what is understood about how as computing power intensifies, and as we glean enhanced
the climate system functions. They then test the efficacy of a data from proxy indicators, climate models are improving in
model by entering past climate data and running the model resolution and are predicting climate change region by region
toward the present. If a model accurately reconstructs current across the world. 509
M18_WITH7428_05_SE_C18.indd 509 12/12/14 4:05 PM