Page 514 - Environment: The Science Behind the Stories
P. 514

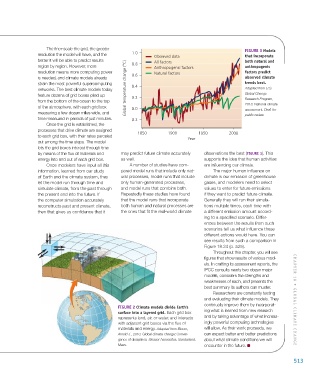
The finer-scale the grid, the greater                                             Figure 3 Models
                        resolution the model will have, and the   1.0   Observed data                         that incorporate
                        better it will be able to predict results       All factors                           both natural and
                        region by region. However, more        0.8      Anthropogenic factors                 anthropogenic
                        resolution means more computing power           Natural factors                       factors predict
                        is needed, and climate models already   0.6                                           observed climate
                        strain the most powerful supercomputing   0.4                                         trends best.
                        networks. The best climate models today   Global temperature change (°C)              Adapted from U.S.
                        feature dozens of grid boxes piled up   0.2                                           Global Change
                        from the bottom of the ocean to the top                                               Research Program,
                        of the atmosphere, with each grid box   0.0                                           2013. National climate
                        measuring a few dozen miles wide, and                                                 assessment. Draft for
                                                                                                              public review.
                        time measured in periods of just minutes.  –0.2
                            Once the grid is established, the
                        processes that drive climate are assigned
                        to each grid box, with their rates parceled   1850    1900         1950        2000
                        out among the time steps. The model                           Year
                        lets the grid boxes interact through time
                        by means of the flux of materials and   may predict future climate accurately   observations the best (Figure 3). This
                        energy into and out of each grid box.  as well.                      supports the idea that human activities
                            Once modelers have input all this   A number of studies have com-  are influencing our climate.
                        information, learned from our study   pared model runs that include only nat-  The major human influence on
                        of Earth and the climate system, they   ural processes, model runs that include   climate is our emission of greenhouse
                        let the model run through time and   only human-generated processes,   gases, and modelers need to select
                        simulate climate, from the past through   and model runs that combine both.   values to enter for future emissions
                        the present and into the future. If   Repeatedly these studies have found   if they want to predict future climate.
                        the computer simulation accurately   that the model runs that incorporate   Generally they will run their simula-
                        reconstructs past and present climate,   both human and natural processes are   tions multiple times, each time with
                        then that gives us confidence that it   the ones that fit the real-world climate   a different emission amount accord-
                                                                                             ing to a specified scenario. Differ-
                                                                                             ences between the results from such
                                                                                             scenarios tell us what influence these
                                                                                             different actions would have. You can
                                                                                             see results from such a comparison in
                                                                                             Figure 18.24 (p. 525).
                                                                                                 Throughout this chapter, you will see
                                                                                             figures that show results of various mod-
                                                                                             els. In crafting its assessment reports, the
                                                                                             IPCC consults nearly two dozen major
                                                                                             models, considers the strengths and
                                                                                             weaknesses of each, and presents the
                                                                                             best summary its authors can muster.
                                                                                                 Researchers are constantly testing
                                                                                             and evaluating their climate models. They   CHAPTER 18 •  Glob al Cli M aT e Chan G e
                                                                                             continually improve them by incorporat-
                                                          Figure 2 climate models divide earth’s
                                                          surface into a layered grid. Each grid box   ing what is learned from new research
                                                          represents land, air, or water, and interacts   and by taking advantage of what increas-
                                                          with adjacent grid boxes via the flux of   ingly powerful computing technologies
                                                          materials and energy. Adapted from Bloom,   will allow. As their work proceeds, we
                                                          Arnold J., 2010. Global climate change: Conver-  can expect better and better predictions
                                                          gence of disciplines. Sinauer Associates, Sunderland,   about what climate conditions we will
                                                          Mass.                              encounter in the future.


                                                                                                                                  513


           M18_WITH7428_05_SE_C18.indd   513                                                                                    12/12/14   4:05 PM
   509   510   511   512   513   514   515   516   517   518   519