
Page 518 - Environment: The Science Behind the Stories
P. 518
250 siderably. The tsunami killed 100 Maldives residents and left
Causes of sea level rise, 1993–2003 20,000 homeless. Schools, boats, tourist resorts, hospitals,
200 Thermal expansion ~57% and transportation and communication infrastructure were
Sea level rise (mm) 100 Greenland and Antarctic ice sheets ~15% damage in the Maldives totaled $470 million, an astounding
~28%
Glaciers and ice caps
damaged or destroyed. The World Bank estimated that direct
150
62% of the nation’s gross domestic product (GDP). Indirect
damage from soil erosion, saltwater contamination of aqui-
50
Tide gauge data
Satellite data
0
losses today.
Statistical uncertainty fers, and other impacts continues to cause further economic
–50 The Maldives has actually fared better against sea level
1870 1900 1950 2000 rise than many other island nations. It has seen sea levels rise
Year about 3 mm per year since 1990, but most Pacific islands are
experiencing greater rises in sea level, some up to 9 mm/year.
Figure 18.14 Global average sea level has risen over
200 mm (7.9 in.) since 1870. Data from tide gauges and satellite Regions experience differing amounts of sea level change
observations each confirm the same trend. Thermal expansion of because land may be rising or subsiding naturally, depending
water accounts for most sea level rise. Data from Intergovernmental on local geological conditions.
Panel on Climate Change, 2007. Fourth assessment report; and CSIRO. In the United States, Hurricane Sandy demonstrated the
impact that storm surges can have even on highly developed
waves struck the Maldives and triggered a campaign to build metropolitan areas (Figure 18.15). This massive hurricane bat-
a large seawall around Malé, the nation’s capital. “The Great tered the eastern part of the nation in October 2012, causing
Wall of Malé” is intended to protect buildings and roads by over $60 billion in damage and leaving over 130 people dead
dissipating the energy of incoming waves during storm surges. and thousands homeless. New York City and the New Jersey
On December 26, 2004, the Maldives was hit by a coast bore the brunt of the storm. In New Jersey, thousands
massive tsunami (pp. 60–61) that devastated coastal areas of beach houses were destroyed, iconic boardwalks were
throughout the Indian Ocean. The tsunami was triggered by washed away, and whole coastal communities were inundated
an earthquake, not by climate change—yet as sea level rises, with salt water and tons of sand thrown up by the storm. In
the damage that such natural events can inflict increases con- Manhattan, economic activity ground to a halt as tunnels and
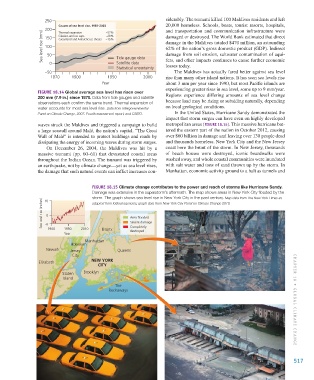
Figure 18.15 Climate change contributes to the power and reach of storms like Hurricane Sandy.
Damage was extensive in the superstorm’s aftermath. The map shows areas in New York City flooded by the
storm. The graph shows sea level rise in New York City in the past century. Map data from The New York Times as
Sea level rise (inches) 0 Area flooded
10
adapted from federal agencies; graph data from New York City Panel on Climate Change 2010.
-6
Completely
1900 1950 2010 Bronx Severe damage
destroyed
Year
Manhattan
Hoboken
Newark Jersey Queens
City
Elizabeth NEW YORK
CITY
Staten Brooklyn
Island
The
Rockaways CHAPTER 18 • Glob al Cli M aT e Chan G e
517
M18_WITH7428_05_SE_C18.indd 517 12/12/14 4:05 PM