
Page 516 - Environment: The Science Behind the Stories
P. 516
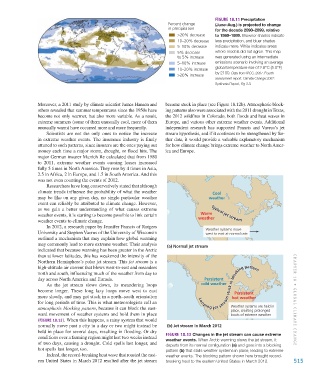
Figure 18.11 Precipitation
                                                                              Percent change      (June–Aug.) is projected to change
                                                                              in precipitation    for the decade 2090–2099, relative
                                                                                  >20% decrease   to 1980–1999. Browner shades indicate
                                                                                  10–20% decrease  less precipitation, and bluer shades
                                                                                  5–10% decrease  indicate more. White indicates areas
                                                                                  5% decrease     where models did not agree. This map
                                                                                  to 5% increase  was generated using an intermediate
                                                                                  5–10% increase  emissions scenario involving an average
                                                                                  10–20% increase  global temperature rise of 2.8°C (5.0°F)
                                                                                                  by 2100. Data from IPCC, 2007. Fourth
                                                                                  >20% increase
                                                                                                  assessment report. Climate Change 2007:
                                                                                                  Synthesis Report, Fig 3.3.


                        Moreover, a 2011 study by climate scientist James Hansen and   became stuck in place (see Figure 18.12b). Atmospheric block-
                        others revealed that summer temperatures since the 1950s have   ing patterns also were associated with the 2011 drought in Texas,
                        become not only warmer, but also more variable. As a result,   the 2012 wildfires in Colorado, both floods and heat waves in
                        extreme summers (some of them unusually cool, more of them   Europe, and various other extreme weather events. Additional
                        unusually warm) have occurred more and more frequently.  independent research has supported Francis and Vavrus’s jet
                            Scientists are not the only ones to notice the increase   stream hypothesis, and if it continues to be strengthened by fur-
                        in extreme weather events. The insurance industry is finely   ther data, it would provide a valuable explanatory mechanism
                        attuned to such patterns, since insurers are the ones paying out   for how climate change brings extreme weather to North Amer-
                        money each time a major storm, drought, or flood hits. The   ica and Europe.
                        major German insurer Munich Re calculated that from 1980
                        to 2011, extreme weather events causing losses increased
                        fully 5 times in North America. They rose by 4 times in Asia,
                        2.5 in Africa, 2 in Europe, and 1.5 in South America. And this
                        was not even counting the events of 2012.
                            Researchers have long conservatively stated that although
                        climate trends influence the probability of what the weather             Cool
                        may be like on any given day, no single particular weather             weather
                        event can reliably be attributed to climate change. However,
                        as we gain a better understanding of what causes extreme
                        weather events, it is starting to become possible to link certain   Warm  Typical jet stream
                                                                                                Typical jet stream
                        weather events to climate change.                                  weather
                            In 2012, a research paper by Jennifer Francis of Rutgers
                        University and Stephen Vavrus of the University of Wisconsin          Weather systems move
                                                                                              west to east at normal rate
                        outlined a mechanism that may explain how global warming
                        may commonly lead to more extreme weather. Their analysis   (a) Normal jet stream
                        indicated that because warming has been greater in the Arctic
                        than at lower latitudes, this has weakened the intensity of the
                        Northern Hemisphere’s polar jet stream. This jet stream is a
                        high-altitude air current that blows west-to-east and meanders
                                                                                           Looping jet stream stuck in blocking pattern
                        north and south, influencing much of the weather from day to
                        day across North America and Eurasia.                                Persistent
                                                                                            cold weather
                            As the jet stream slows down, its meandering loops             Looping jet stream stuck in blocking pattern
                        become longer.  These long lazy loops move west to east                           Persistent
                        more slowly, and may get stuck in a north–south orientation                      hot weather
                        for long periods of time. This is what meteorologists call an                                             CHAPTER 18 •  Glob al Cli M aT e Chan G e
                        atmospheric blocking pattern, because it can block the east-                    Weather systems are held in
                                                                                                        place, creating prolonged
                        ward movement of weather systems and hold them in place                         bouts of extreme weather
                        (Figure 18.12). When this happens, a rainy system that would
                        normally move past a city in a day or two might instead be   (b) Jet stream in March 2012
                        held in place for several days, resulting in flooding. Or dry
                        conditions over a farming region might last two weeks instead   Figure 18.12 Changes in the jet stream can cause extreme
                                                                             weather events. When Arctic warming slows the jet stream, it
                        of two days, causing a drought. Cold spells last longer, and   departs from its normal configuration (a) and goes into a blocking
                        hot spells last longer, too.                         pattern (b) that stalls weather systems in place, leading to extreme
                            Indeed, the record-breaking heat wave that roasted the east-  weather events. The blocking pattern shown here brought record-
                        ern United States in March 2012 resulted after the jet stream   breaking heat to the eastern United States in March 2012.  515


           M18_WITH7428_05_SE_C18.indd   515                                                                                    12/12/14   4:05 PM