
Page 512 - Environment: The Science Behind the Stories
P. 512
extremely hot days and heat waves have increased globally,
Table 18.2 observed and Predicted Trends and im- whereas the number of cold days has decreased. Accord-
pacts of climate change, from iPcc Fourth ing to the WMO, the 18 warmest years on record since
Assessment Report
global measurements began 150 years ago have all been
GLOBAL PHYSICAL INDICATORS since 1990. The decade from 2001–2010 was the hottest
Average surface temperature increased 0.74°C (1.33°F) in the past ever recorded, and since the 1960s each decade has been
100 years, and will rise 1.8–4.0°C (3.2–7.2°F) in the 21st century. warmer than the last.
In fact, consider this: If you were born after 1985, you
Oceans absorbed >80% of heat added to the climate system and
warmed to depths of at least 3000 m (9800 ft). have never in your life lived through a month with average
global temperatures lower than the 20th-century average.
Glaciers, snow cover, ice caps, ice sheets, and sea ice are melting
and will continue, contributing to sea level rise.
Sea level rose by an average of 17 cm (7 in.) in the 20th century
and will rise 18–59 cm (7–23 in.) in the 21st century.
Ocean water became more acidic by about 0.1 pH unit and will 58.5
decrease in pH by 0.14–0.35 units more by century’s end.
Storm surges increased, and will increase further.
Carbon uptake by terrestrial ecosystems will peak by mid-century, 58.0
then weaken or reverse, amplifying climate change.
REGIONAL PHYSICAL INDICATORS Average global temperature (°F) 57.5
Arctic areas warmed fastest. Future warming will be greatest in the
Arctic and greater over land than over water.
Summer Arctic sea ice thinned by 7.4% per decade since 1978. 57.0
Precipitation will increase at high latitudes and decrease at sub-
tropical latitudes, making wet areas wetter and dry ones drier. 56.5
Droughts became longer, more intense, and more widespread 1880 1900 1920 1940 1960 1980 2000
since the 1970s, especially in the tropics and subtropics. Year
Droughts and flooding will increase, leading to agricultural losses. (a) Global temperature measured since 1880
Hurricanes have intensified in the North Atlantic since 1970 and
1
will continue to intensify.
SOCIAL INDICATORS
0.5
Farmers and foresters have had to adapt to altered growing sea-
sons and disturbance regimes.
Temperate-zone crop yields will rise until 3°C (5.4°F) warming. In
dry tropics and subtropics, crop productivity will fall. 0.0
Impacts on biodiversity will cause losses of food, water, and other Departures in temperature (°C) from the 1961–1990 average
ecosystem goods and services.
Sea level rise will displace people from islands and coasts. –0.5
Melting of mountain glaciers will reduce water supplies to millions.
Economic costs will outweigh benefits. Costs could average 1–5%
of GDP globally for 4°C (7.2°F) of warming. –1.0
Poorer nations and communities are suffering more.
Human health will suffer as increased warm-weather health haz- 1000 1200 1400 1600 1800 2000
ards outweigh decreased cold-weather health hazards. Year
BIOLOGICAL INDICATORS (b) Northern Hemisphere temperature over the
past 1000 years
Species ranges are shifting toward the poles and upward in eleva- CHAPTER 18 • Glob al Cli M aT e Chan G e
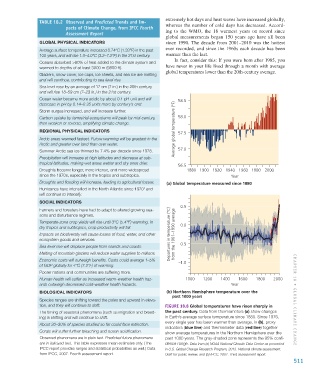
tion, and they will continue to shift. Figure 18.8 Global temperatures have risen sharply in
The timing of seasonal phenomena (such as migration and breed- the past century. Data from thermometers (a) show changes
ing) is shifting and will continue to shift. in Earth’s average surface temperature since 1880. Since 1976,
every single year has been warmer than average. In (b), proxy
About 20–30% of species studied so far could face extinction.
indicators (blue line) and thermometer data (red line) together
Corals will suffer further bleaching and ocean acidification. show average temperatures in the Northern Hemisphere over the
Observed phenomena are in plain text. Predicted future phenomena past 1000 years. The gray-shaded zone represents the 95% confi-
are in italicized text. This table expresses mean estimates only. (The dence range. Data from (a) NOAA National Climatic Data Center as presented
IPCC report provides ranges and statistical probabilities as well.) Data in U.S. Global Change Research Program, 2013. National climate assessment.
from IPCC, 2007. Fourth assessment report. Draft for public review; and (b) IPCC, 2001. Third assessment report.
511
M18_WITH7428_05_SE_C18.indd 511 12/12/14 4:05 PM