
Page 515 - Environment: The Science Behind the Stories
P. 515
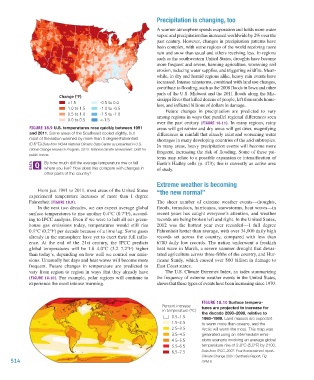
Precipitation is changing, too

                                                                          A warmer atmosphere speeds evaporation and holds more water
                                                                          vapor, and precipitation has increased worldwide by 2% over the
                                                                          past century. However, changes in precipitation patterns have
                                                                          been complex, with some regions of the world receiving more
                                                                          rain and snow than usual and others receiving less. In regions
                                                                          such as the southwestern United States, droughts have become
                                                                          more frequent and severe, harming agriculture, worsening soil
                                                                          erosion, reducing water supplies, and triggering wildfire. Mean-
                                                                          while, in dry and humid regions alike, heavy rain events have
                                                                          increased. Intense rainstorms, combined with land use changes,
                                                                          contribute to flooding, such as the 2008 floods in Iowa and other
                                                                          parts of the U.S. Midwest and the 2011 floods along the Mis-
                                 Change (ºF)                              sissippi River that killed dozens of people, left thousands home-
                                     >1.5         -0.5 to 0.0             less, and inflicted billions of dollars in damage.
                                     1.0 to 1.5   -1.0 to -0.5               Future changes in precipitation are predicted to vary
                                     0.5 to 1.0   -1.5 to -1.0            among regions in ways that parallel regional differences seen
                                     0.0 to 0.5   <-1.5
                                                                          over the past century (Figure 18.11). In many regions, rainy
                     Figure 18.9 U.S. temperatures rose quickly between 1991   areas will get rainier and dry areas will get drier, magnifying
                     and 2011. Some areas of the Southeast cooled slightly, but   differences in rainfall that already exist and worsening water
                     most of the nation warmed by more than 1 degree Fahrenheit   shortages in many developing countries of the arid subtropics.
                     (0.6°C).Data from NOAA National Climatic Data Center as presented in U.S.   In many areas, heavy precipitation events will become more
                     Global Change Research Program, 2013. National climate assessment. Draft for   frequent, increasing the risk of flooding. Some of these pat-
                     public review.
                                                                          terns may relate to a possible expansion or intensification of
                             By how much did the average temperature rise or fall   Earth’s Hadley cells (p. 473); this is currently an active area
                           where you live? How does this compare with changes in   of study.
                           other parts of the country?
                                                                          Extreme weather is becoming
                        From just 1991 to 2011, most areas of the United States   “the new normal”
                     experienced temperature increases of more than 1 degree
                     Fahrenheit (Figure 18.9).                            The sheer number of extreme weather events—droughts,
                        In the next two decades, we can expect average global   floods, tornadoes, hurricanes, snowstorms, heat waves—in
                     surface temperatures to rise another 0.4°C (0.7°F), accord-  recent years has caught everyone’s attention, and weather
                     ing to IPCC analysis. Even if we were to halt all our green-  records are being broken left and right. In the United States,
                     house gas emissions today, temperatures would still rise   2012 was the hottest year ever recorded—1 full degree
                     0.1°C (0.2°F) per decade because of a time lag: Some gases   Fahrenheit hotter than average, with over 34,000 daily high
                     already in the atmosphere have yet to exert their full influ-  records set across the country, compared with less than
                     ence.  At the end of the 21st century, the IPCC predicts   6700 daily low records. The nation underwent a freakish
                     global temperatures will be 1.8–4.0°C (3.2–7.2°F) higher   heat wave in March, a severe summer drought that devas-
                     than today’s, depending on how well we control our emis-  tated agriculture across three-fifths of the country, and Hur-
                     sions. Unusually hot days and heat waves will become more   ricane Sandy, which caused over $60 billion in damage to
                     frequent. Future changes in temperature are predicted to   East Coast states.
                     vary from region to region in ways that they already have   The U.S. Climate Extremes Index, an index summarizing
                     (Figure 18.10). For example, polar regions will continue to   the frequency of extreme weather events in the United States,
                     experience the most intense warming.                 shows that these types of events have been increasing since 1970.


                                                                                            Figure 18.10 Surface tempera-
                                                                            Percent increase   tures are projected to increase for
                                                                            in temperature (ºC)
                                                                                            the decade 2090–2099, relative to
                                                                                0.5–1.5     1980–1999. Land masses are expected
                                                                                1.5–2.5     to warm more than oceans, and the
                                                                                2.5–3.5     Arctic will warm the most. This map was
                                                                                3.5–4.5     generated using an intermediate emis-
                                                                                4.5–5.5     sions scenario involving an average global
                                                                                5.5–6.5     temperature rise of 2.8°C (5.0°F) by 2100.
                                                                                6.5–7.5     Data from IPCC, 2007. Fourth assessment report.
                                                                                            Climate Change 2007: Synthesis Report, Fig
             514                                                                            SPM.6.


           M18_WITH7428_05_SE_C18.indd   514                                                                                    12/12/14   4:05 PM