
Page 541 - Environment: The Science Behind the Stories
P. 541
Products and other uses
Imports
Transportation
Oil
Export
Imports
Industrial
Natural gas
Export
Export Commercial
Coal
Residential
Imports
Nuclear
Renewables
Electricity generation
Lost
energy
Production and imports Consumption Losses
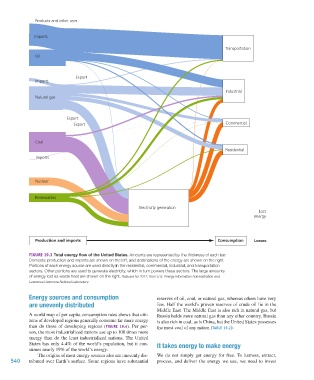
FIGURE 19.3 Total energy flow of the United States. Amounts are represented by the thickness of each bar.
Domestic production and imports are shown on the left, and destinations of the energy are shown on the right.
Portions of each energy source are used directly in the residential, commercial, industrial, and transportation
sectors. Other portions are used to generate electricity, which in turn powers these sectors. The large amounts
of energy lost as waste heat are shown on the right. Data are for 2012, from U.S. Energy Information Administration and
Lawrence Livermore National Laboratory.
Energy sources and consumption reserves of oil, coal, or natural gas, whereas others have very
are unevenly distributed few. Half the world’s proven reserves of crude oil lie in the
Middle East. The Middle East is also rich in natural gas, but
A world map of per capita consumption rates shows that citi- Russia holds more natural gas than any other country. Russia
zens of developed regions generally consume far more energy is also rich in coal, as is China, but the United States possesses
than do those of developing regions (FIGURE 19.4). Per per- the most coal of any nation (TABLE 19.2).
son, the most industrialized nations use up to 100 times more
energy than do the least industrialized nations. The United
States has only 4.4% of the world’s population, but it con- It takes energy to make energy
sumes nearly 19% of the world’s energy.
The origins of most energy sources also are unevenly dis- We do not simply get energy for free. To harness, extract,
540 tributed over Earth’s surface. Some regions have substantial process, and deliver the energy we use, we need to invest
M19_WITH7428_05_SE_C19.indd 540 12/12/14 5:22 PM