
Page 542 - Environment: The Science Behind the Stories
P. 542
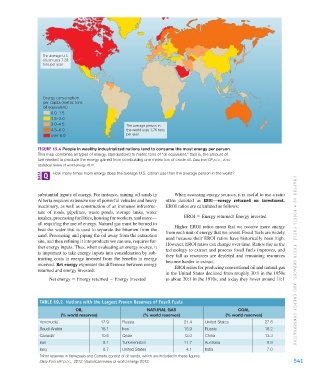
The average U.S.
                          citizen uses 7.28
                          tons per year


                           Energy consumption
                           per capita (metric tons
                           oil equivalent)
                              0.0–1.5
                              1.5–3.0
                              3.0–4.5                        The average person in
                              4.5–6.0                        the world uses 1.76 tons
                              over 6.0                       per year

                        FIGURE 19.4 People in wealthy industrialized nations tend to consume the most energy per person.
                        This map combines all types of energy, standardized to metric tons of “oil equivalent,” that is, the amount of
                        fuel needed to produce the energy gained from combusting one metric ton of crude oil. Data from BP p.l.c., 2012.
                        Statistical review of world energy 2012.
                               How many times more energy does the average U.S. citizen use than the average person in the world?


                        substantial inputs of energy. For instance, mining oil sands in   When assessing energy sources, it is useful to use a ratio
                        Alberta requires extensive use of powerful vehicles and heavy   often denoted as  EROI—energy  returned  on  investment.
                        machinery, as well as construction of an immense infrastruc-  EROI ratios are calculated as follows:
                        ture of roads, pipelines, waste ponds, storage tanks, water
                        intakes, processing facilities, housing for workers, and more—  EROI 5 Energy returned/ Energy invested
                        all requiring the use of energy. Natural gas must be burned to   Higher EROI ratios mean that we receive more energy
                        heat the water that is used to separate the bitumen from the   from each unit of energy that we invest. Fossil fuels are widely
                        sand. Processing and piping the oil away from the extraction   used because their EROI ratios have historically been high.
                        site, and then refining it into products we can use, requires fur-  However, EROI ratios can change over time. Ratios rise as the
                        ther energy inputs. Thus, when evaluating an energy source, it   technology to extract and process fossil fuels improves, and
                        is important to take energy inputs into consideration by sub-  they fall as resources are depleted and remaining resources
                        tracting costs in energy invested from the benefits in energy   become harder to extract.                 CHAPTER 19 •  FOSSIL FUELS, THEIR IMPA CT S, AND ENERGY CONSERVATI ON
                        received. Net energy expresses the difference between energy   EROI ratios for producing conventional oil and natural gas
                        returned and energy invested:
                                                                             in the United States declined from roughly 30:1 in the 1950s
                             Net energy 5 Energy returned 2 Energy invested  to about 20:1 in the 1970s, and today they hover around 11:1


                         TABLE 19.2  Nations with the Largest Proven Reserves of Fossil Fuels
                                        OIL                           NATURAL GAS                          COAL
                                  (% world reserves)                (% world reserves)                (% world reserves)
                         Venezuela *              17.9     Russia                    21.4    United States            27.6
                         Saudi Arabia             16.1     Iran                      15.9    Russia                   18.2
                         Canada *                 10.6     Qatar                     12.0    China                    13.3
                         Iran                      9.1     Turkmenistan              11.7    Australia                 8.9
                         Iraq                      8.7     United States              4.1    India                     7.0
                         * Most reserves in Venezuela and Canada consist of oil sands, which are included in these figures.
                         Data from BP p.l.c., 2012. Statistical review of world energy 2012.                                      541


           M19_WITH7428_05_SE_C19.indd   541                                                                                    12/12/14   5:22 PM