
Page 552 - Basic College Mathematics with Early Integers
P. 552
Answers
Integrated Review Sections 7.1–7.2
Reading Graphs
1.
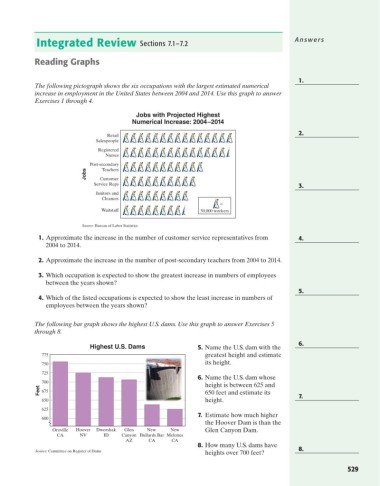
The following pictograph shows the six occupations with the largest estimated numerical
increase in employment in the United States between 2004 and 2014. Use this graph to answer
Exercises 1 through 4.
Jobs with Projected Highest
Numerical Increase: 2004–2014
2.
Retail
Salespeople
Registered
Nurses
Post-secondary
Teachers
Jobs Customer
Service Reps 3.
Janitors and
Cleaners
Waitstaff 50,000 workers
Source: Bureau of Labor Statistics
1. Approximate the increase in the number of customer service representatives from 4.
2004 to 2014.
2. Approximate the increase in the number of post-secondary teachers from 2004 to 2014.
3. Which occupation is expected to show the greatest increase in numbers of employees
between the years shown?
5.
4. Which of the listed occupations is expected to show the least increase in numbers of
employees between the years shown?
The following bar graph shows the highest U.S. dams. Use this graph to answer Exercises 5
through 8.
6.
Highest U.S. Dams 5. Name the U.S. dam with the
775 greatest height and estimate
750 its height.
725
6. Name the U.S. dam whose
700 height is between 625 and
Feet 675 650 feet and estimate its
650 height. 7.
625
7. Estimate how much higher
600
the Hoover Dam is than the
Oroville Hoover Dworshak Glen New New Glen Canyon Dam.
CA NV ID Canyon Bullards Bar Melones
AZ CA CA
8. How many U.S. dams have
Source: Committee on Register of Dams 8.
heights over 700 feet?
529