
Page 551 - Basic College Mathematics with Early Integers
P. 551
528 C HAPTE R 7 I STATISTICS AND PROBABILITY
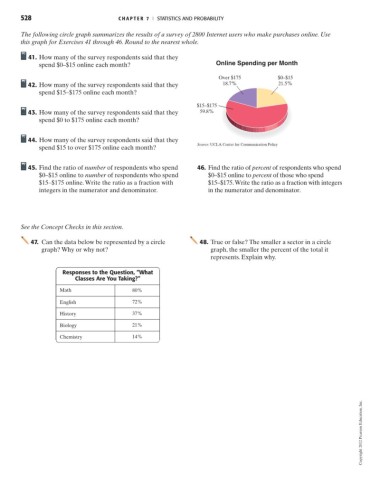
The following circle graph summarizes the results of a survey of 2800 Internet users who make purchases online. Use
this graph for Exercises 41 through 46. Round to the nearest whole.
41. How many of the survey respondents said that they
spend $0–$15 online each month? Online Spending per Month
Over $175 $0–$15
42. How many of the survey respondents said that they 18.7% 21.5%
spend $15–$175 online each month?
$15–$175
43. How many of the survey respondents said that they 59.8%
spend $0 to $175 online each month?
44. How many of the survey respondents said that they
Source: UCLA Center for Communication Policy
spend $15 to over $175 online each month?
45. Find the ratio of number of respondents who spend 46. Find the ratio of percent of respondents who spend
$0–$15 online to number of respondents who spend $0–$15 online to percent of those who spend
$15–$175 online.Write the ratio as a fraction with $15–$175.Write the ratio as a fraction with integers
integers in the numerator and denominator. in the numerator and denominator.
See the Concept Checks in this section.
47. Can the data below be represented by a circle 48. True or false? The smaller a sector in a circle
graph? Why or why not? graph, the smaller the percent of the total it
represents. Explain why.
Responses to the Question, “What
Classes Are You Taking?”
Math 80%
English 72%
History 37%
Biology 21%
Chemistry 14%
Copyright 2012 Pearson Education, Inc.