
Page 546 - Basic College Mathematics with Early Integers
P. 546
S E C T ION 7. 2 I READING CIRCLE GRAPHS 523
Example 4 Drawing a Circle Graph for U.S. Armed PRACTICE 4
Forces Personnel Use the data shown to draw a
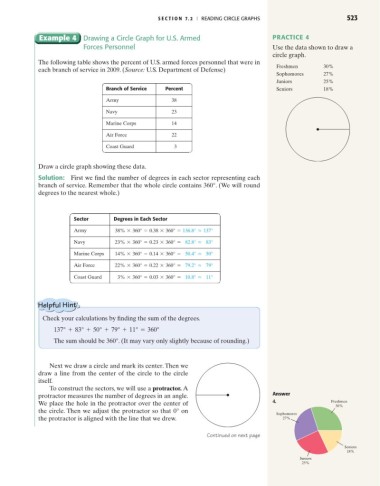
circle graph.
The following table shows the percent of U.S. armed forces personnel that were in
Freshmen 30%
each branch of service in 2009. (Source: U.S. Department of Defense)
Sophomores 27%
Juniors 25%
Branch of Service Percent Seniors 18%
Army 38
Navy 23
Marine Corps 14
Air Force 22
Coast Guard 3
Draw a circle graph showing these data.
Solution: First we find the number of degrees in each sector representing each
branch of service. Remember that the whole circle contains 360°. (We will round
degrees to the nearest whole.)
Sector Degrees in Each Sector
Army 38% * 360° = 0.38 * 360° = 136.8° L 137°
Navy 23% * 360° = 0.23 * 360° = 82.8° L 83°
Marine Corps 14% * 360° = 0.14 * 360° = 50.4° L 50°
Air Force 22% * 360° = 0.22 * 360° = 79.2° L 79°
Coast Guard 3% * 360° = 0.03 * 360° = 10.8° L 11°
Check your calculations by finding the sum of the degrees.
137° + 83° + 50° + 79° + 11° = 360°
The sum should be 360°. (It may vary only slightly because of rounding.)
Next we draw a circle and mark its center. Then we
draw a line from the center of the circle to the circle
itself.
To construct the sectors, we will use a protractor. A
protractor measures the number of degrees in an angle. Answer
We place the hole in the protractor over the center of 4. Freshmen
30%
the circle. Then we adjust the protractor so that 0° on
Sophomores
the protractor is aligned with the line that we drew. 27%
Continued on next page
Seniors
18%
Juniors
25%