
Page 545 - Basic College Mathematics with Early Integers
P. 545
522 C HAPTE R 7 I STATISTICS AND PROBABILITY
Since a circle graph represents a whole, the percents should add to 100% or 1.
Notice this is true for Example 2.
PRACTICE 3 Example 3 Finding Percent of Population
Use the information in
Example 3 and the circle graph The U.S. Department of Commerce forecasts 61 million international visitors to
from Example 2 to estimate the the United States in 2011. Use the circle graph from Example 2 and estimate the
number of tourists from number of tourists that might be from Europe.
Mexico in 2011. Solution: We use the percent equation.
#
amount = percent base
#
amount = 0.253 61,000,000
= 0.253(61,000,000)
= 15,433,000
Thus, 15,433,000 tourists might come from Europe in 2011.
Work Practice 3
Concept Check Can the following data be represented by a circle graph?
Why or why not?
Responses to the Question, “In
Which Activities Are You Involved?”
Intramural sports 60%
On-campus job 42%
Fraternity/sorority 27%
Academic clubs 21%
Music programs 14%
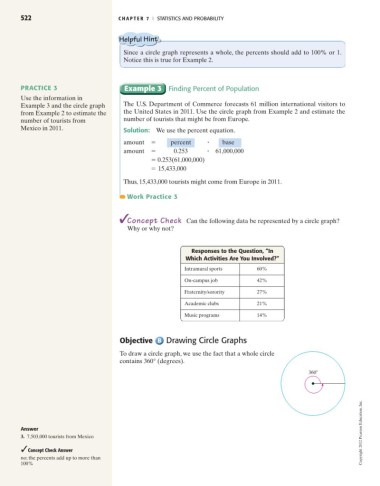
Objective Drawing Circle Graphs
To draw a circle graph, we use the fact that a whole circle
contains 360° (degrees).
360
Copyright 2012 Pearson Education, Inc.
Answer
3. 7,503,000 tourists from Mexico
Concept Check Answer
no; the percents add up to more than
100%