
Page 543 - Basic College Mathematics with Early Integers
P. 543
520 C HAPTE R 7 I STATISTICS AND PROBABILITY
Review
Find each percent. See Sections 6.2 and 6.3.
71. 30% of 12 72. 45% of 120 73. 10% of 62 74. 95% of 50
Write each fraction as a percent. See Section 6.1.
1 2 17 9
75. 76. 77. 78.
4 5 50 10
Concept Extensions
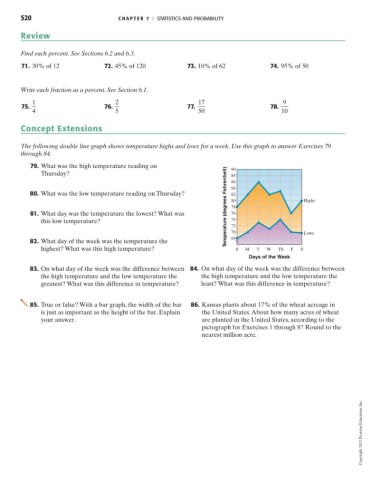
The following double line graph shows temperature highs and lows for a week. Use this graph to answer Exercises 79
through 84.
79. What was the high temperature reading on 90
T emperature (degrees Fahrenheit) 78
Thursday? 88
86
80. What was the low temperature reading on Thursday? 84 Highs
82
80
81. What day was the temperature the lowest? What was 76
this low temperature? 74
72
68
82. What day of the week was the temperature the 70 Lows
highest? What was this high temperature? S M T W Th F S
Days of the Week
83. On what day of the week was the difference between 84. On what day of the week was the difference between
the high temperature and the low temperature the the high temperature and the low temperature the
greatest? What was this difference in temperature? least? What was this difference in temperature?
85. True or false? With a bar graph, the width of the bar 86. Kansas plants about 17% of the wheat acreage in
is just as important as the height of the bar. Explain the United States.About how many acres of wheat
your answer. are planted in the United States, according to the
pictograph for Exercises 1 through 8? Round to the
nearest million acre.
Copyright 2012 Pearson Education, Inc.