
Page 541 - Basic College Mathematics with Early Integers
P. 541
518 C HAPTE R 7 I STATISTICS AND PROBABILITY
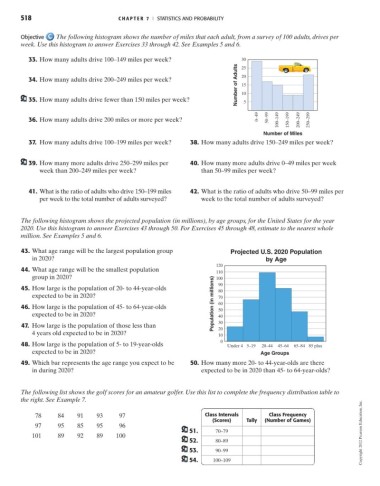
Objective The following histogram shows the number of miles that each adult, from a survey of 100 adults, drives per
week. Use this histogram to answer Exercises 33 through 42. See Examples 5 and 6.
33. How many adults drive 100–149 miles per week? 30
Number of Adults 15
25
34. How many adults drive 200–249 miles per week? 20
35. How many adults drive fewer than 150 miles per week? 10 5
36. How many adults drive 200 miles or more per week? 0–49 50–99 100–149 150–199 200–249 250–299
Number of Miles
37. How many adults drive 100–199 miles per week? 38. How many adults drive 150–249 miles per week?
39. How many more adults drive 250–299 miles per 40. How many more adults drive 0–49 miles per week
week than 200–249 miles per week? than 50–99 miles per week?
41. What is the ratio of adults who drive 150–199 miles 42. What is the ratio of adults who drive 50–99 miles per
per week to the total number of adults surveyed? week to the total number of adults surveyed?
The following histogram shows the projected population (in millions), by age groups, for the United States for the year
2020. Use this histogram to answer Exercises 43 through 50. For Exercises 45 through 48, estimate to the nearest whole
million. See Examples 5 and 6.
43. What age range will be the largest population group Projected U.S. 2020 Population
in 2020? by Age
120
44. What age range will be the smallest population
110
group in 2020? 100
45. How large is the population of 20- to 44-year-olds 90
80
expected to be in 2020? 70
46. How large is the population of 45- to 64-year-olds Population (in millions) 60
50
expected to be in 2020? 40
47. How large is the population of those less than 30
20
4 years old expected to be in 2020? 10
0
48. How large is the population of 5- to 19-year-olds Under 4 5–19 20–44 45–64 65–84 85 plus
expected to be in 2020? Age Groups
49. Which bar represents the age range you expect to be 50. How many more 20- to 44-year-olds are there
in during 2020? expected to be in 2020 than 45- to 64-year-olds?
The following list shows the golf scores for an amateur golfer. Use this list to complete the frequency distribution table to
the right. See Example 7.
78 84 91 93 97 Class Intervals Class Frequency
(Scores) Tally (Number of Games)
97 95 85 95 96
51. 70–79 Copyright 2012 Pearson Education, Inc.
101 89 92 89 100
52. 80–89
53. 90–99
54. 100–109