
Page 542 - Basic College Mathematics with Early Integers
P. 542
S E C T ION 7.1 I READING PICTOGRAPHS, BAR GRAPHS, HISTOGRAMS, AND LINE GRAPHS 519
Twenty-five people in a survey were asked to give their current checking account balances. Use the balances shown in the
following list to complete the frequency distribution table to the right. See Example 7.
$53 $105 $162 $443 $109 Class Intervals Class Frequency
(Account Balances) Tally (Number of People)
$468 $47 $259 $316 $228
55. $0–$99
$207 $357 $15 $301 $75
$86 $77 $512 $219 $100 56. $100–$199
$192 $288 $352 $166 $292 57. $200–$299
58. $300–$399
59. $400–$499
60. $500–$599
61. Use the frequency distribution table from Exercises 51 62. Use the frequency distribution table from Exercises 55
through 54 to construct a histogram. See Example 8. through 60 to construct a histogram. See Example 8.
Number of Games 2 Number of People 2
1
1
Golf Scores
Account Balances
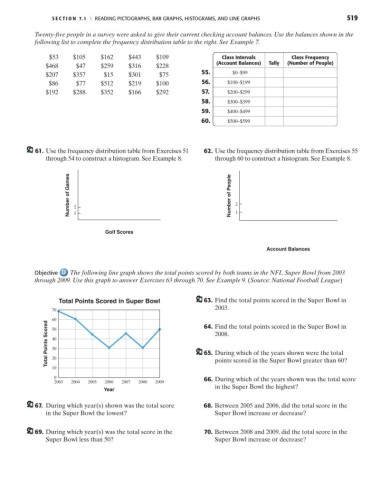
Objective The following line graph shows the total points scored by both teams in the NFL Super Bowl from 2003
through 2009. Use this graph to answer Exercises 63 through 70. See Example 9. (Source: National Football League)
Total Points Scored in Super Bowl 63. Find the total points scored in the Super Bowl in
2003.
70
60 64. Find the total points scored in the Super Bowl in
Total Points Scored 40 65. During which of the years shown were the total
50
2008.
30
20
10 points scored in the Super Bowl greater than 60?
0
2003 2004 2005 2006 2007 2008 2009 66. During which of the years shown was the total score
in the Super Bowl the highest?
Year
67. During which year(s) shown was the total score 68. Between 2005 and 2006, did the total score in the
in the Super Bowl the lowest? Super Bowl increase or decrease?
69. During which year(s) was the total score in the 70. Between 2008 and 2009, did the total score in the
Super Bowl less than 50? Super Bowl increase or decrease?