
Page 537 - Basic College Mathematics with Early Integers
P. 537
514 C HAPTE R 7 I STATISTICS AND PROBABILITY
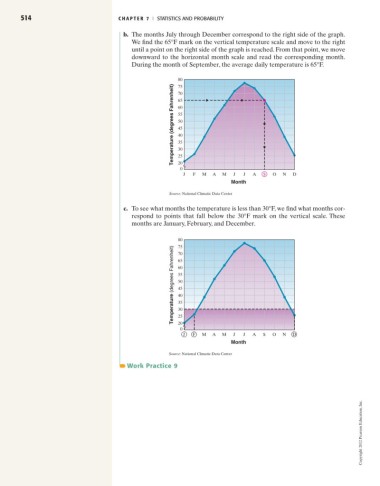
b. The months July through December correspond to the right side of the graph.
We find the 65°F mark on the vertical temperature scale and move to the right
until a point on the right side of the graph is reached. From that point, we move
downward to the horizontal month scale and read the corresponding month.
During the month of September, the average daily temperature is 65°F.
80
Temperature (degrees Fahrenheit) 60
75
70
65
55
50
45
40
35
30
25
20
0
J F M A M J J A S O N D
Month
Source: National Climatic Data Center
c. To see what months the temperature is less than 30°F, we find what months cor-
respond to points that fall below the 30°F mark on the vertical scale. These
months are January, February, and December.
80
75
(degrees Fahrenheit) 65
70
60
55
50
45
Temperature 40
35
30
25
20
0
J F M A M J J A S O N D
Month
Source: National Climatic Data Center
Work Practice 9
Copyright 2012 Pearson Education, Inc.