
Page 533 - Basic College Mathematics with Early Integers
P. 533
510 C HAPTE R 7 I STATISTICS AND PROBABILITY
PRACTICE 4 Next, we practice constructing a bar graph.
Draw a vertical bar graph using
the information in the table
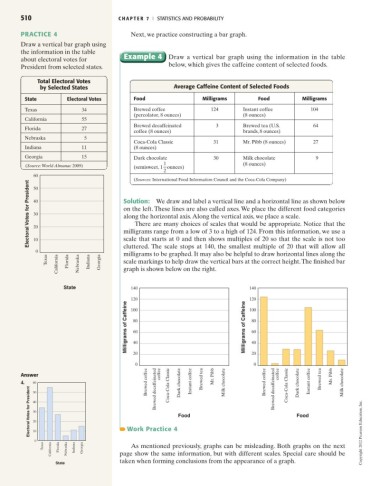
about electoral votes for Example 4 Draw a vertical bar graph using the information in the table
President from selected states. below, which gives the caffeine content of selected foods.
Total Electoral Votes
by Selected States Average Caffeine Content of Selected Foods
State Electoral Votes Food Milligrams Food Milligrams
Texas 34 Brewed coffee 124 Instant coffee 104
(percolator, 8 ounces) (8 ounces)
California 55
Brewed decaffeinated 3 Brewed tea (U.S. 64
Florida 27
coffee (8 ounces) brands, 8 ounces)
Nebraska 5
Coca-Cola Classic 31 Mr. Pibb (8 ounces) 27
Indiana 11 (8 ounces)
Georgia 15 Dark chocolate 30 Milk chocolate 9
1 (8 ounces)
(Source:World Almanac 2009)
(semisweet, 1 ounces )
2
60
(Sources: International Food Information Council and the Coca-Cola Company)
Electoral Votes for President 40 Solution: We draw and label a vertical line and a horizontal line as shown below
50
on the left. These lines are also called axes. We place the different food categories
30
along the horizontal axis.Along the vertical axis, we place a scale.
There are many choices of scales that would be appropriate. Notice that the
20
milligrams range from a low of 3 to a high of 124. From this information, we use a
10
cluttered. The scale stops at 140, the smallest multiple of 20 that will allow all
0 scale that starts at 0 and then shows multiples of 20 so that the scale is not too
milligrams to be graphed. It may also be helpful to draw horizontal lines along the
Texas California Florida Nebraska Indiana Georgia scale markings to help draw the vertical bars at the correct height.The finished bar
graph is shown below on the right.
State 140 140
120 120
Milligrams of Caffeine 80 Milligrams of Caffeine 80
100
100
60
60
40
20 40
20
0 0
Answer coffee Mr. Pibb coffee Mr. Pibb
4. 60 Brewed coffee Brewed decaffeinated Coca-Cola Classic Dark chocolate Instant coffee Brewed tea Milk chocolate Brewed coffee Brewed decaffeinated Coca-Cola Classic Dark chocolate Instant coffee Brewed tea Milk chocolate
Electoral Votes for President 40 Food Food
50
30
20
10
0 Work Practice 4 Copyright 2012 Pearson Education, Inc.
Texas California Florida Nebraska Indiana Georgia page show the same information, but with different scales. Special care should be
As mentioned previously, graphs can be misleading. Both graphs on the next
taken when forming conclusions from the appearance of a graph.
State