Page 534 - Basic College Mathematics with Early Integers
P. 534

S E C T ION  7.1 I READING PICTOGRAPHS, BAR GRAPHS, HISTOGRAMS, AND LINE GRAPHS               511

                Notice the   symbol on each vertical scale on the graphs below. This symbol
            alerts us that numbers are missing from that scale.


                   700,040                           800,000
                 Profit (in dollars)  700,030      Profit (in dollars)  700,000

                   700,020
                                                     600,000
                   700,010
                       0                                 0
                          2002  2003  2004  2005            2002  2003  2004  2005
                                  Year                              Year
                Are profits shown in the graphs above greatly increasing, or are they remaining
            about the same?

            Objective      Reading and Constructing Histograms

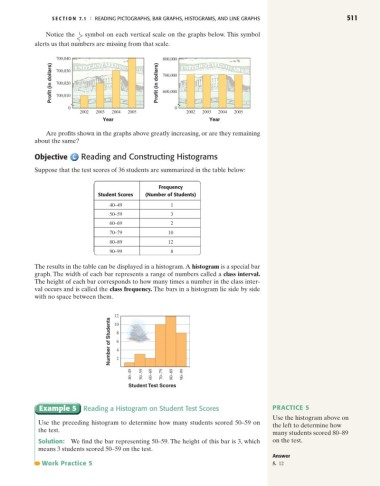
            Suppose that the test scores of 36 students are summarized in the table below:

                                                    Frequency
                                Student Scores  (Number of Students)

                                    40–49              1
                                    50–59              3
                                    60–69              2
                                    70–79              10
                                    80–89              12
                                    90–99              8

            The results in the table can be displayed in a histogram.A histogram is a special bar
            graph. The width of each bar represents a range of numbers called a class interval.
            The height of each bar corresponds to how many times a number in the class inter-
            val occurs and is called the class frequency. The bars in a histogram lie side by side
            with no space between them.


                                      12
                                    Number of Students  8 6 4
                                      10


                                      2

                                           40–49  50–59  60–69  70–79  80–89  90–99

                                          Student Test Scores


             Example 5 Reading a Histogram on Student Test Scores                       PRACTICE 5
                                                                                        Use the histogram above on
             Use the preceding histogram to determine how many students scored 50–59 on
                                                                                        the left to determine how
             the test.
                                                                                        many students scored 80–89
             Solution:  We find the bar representing 50–59. The height of this bar is 3, which  on the test.
             means 3 students scored 50–59 on the test.
                                                                                        Answer
              Work Practice 5                                                           5. 12
   529   530   531   532   533   534   535   536   537   538   539