
Page 532 - Basic College Mathematics with Early Integers
P. 532
S E C T ION 7.1 I READING PICTOGRAPHS, BAR GRAPHS, HISTOGRAMS, AND LINE GRAPHS 509
Example 3 Finding the Number of Endangered Species PRACTICE 3
Use the bar graph in Example 3
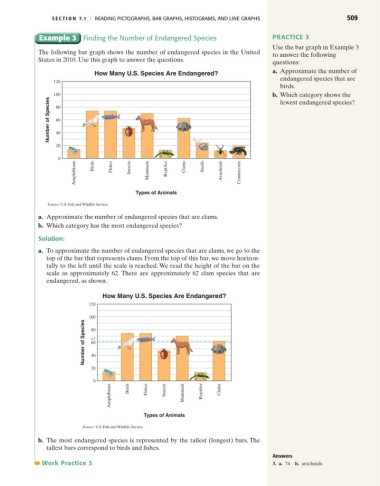
The following bar graph shows the number of endangered species in the United
to answer the following
States in 2010. Use this graph to answer the questions.
questions:
a. Approximate the number of
How Many U.S. Species Are Endangered?
endangered species that are
120
birds.
100 b. Which category shows the
Number of Species 80
fewest endangered species?
60
40
20
0 Birds
Amphibians Fishes Insects Mammals Reptiles Clams Snails Arachnids Crustaceans
Types of Animals
Source: U.S. Fish and Wildlife Service
a. Approximate the number of endangered species that are clams.
b. Which category has the most endangered species?
Solution:
a. To approximate the number of endangered species that are clams, we go to the
top of the bar that represents clams. From the top of this bar, we move horizon-
tally to the left until the scale is reached. We read the height of the bar on the
scale as approximately 62. There are approximately 62 clam species that are
endangered, as shown.
How Many U.S. Species Are Endangered?
120
100
Number of Species 62
80
60
40
20
0
Amphibians Birds Fishes Insects Mammals Reptiles Clams
Types of Animals
Source: U.S. Fish and Wildlife Service
b. The most endangered species is represented by the tallest (longest) bars. The
tallest bars correspond to birds and fishes.
Answers
Work Practice 3 3. a. 74 b. arachnids