
Page 535 - Basic College Mathematics with Early Integers
P. 535
512 C HAPTE R 7 I STATISTICS AND PROBABILITY
PRACTICE 6 Example 6 Reading a Histogram on Student Test Scores
Use the histogram above Use the preceding histogram to determine how many students scored 80 or above
Example 5 to determine how on the test.
many students scored less than
80 on the test. Solution: We see that two different bars fit this description.There are 12 students
who scored 80–89 and 8 students who scored 90–99.The sum of these two categories
PRACTICE 7 is 12 + 8 or 20 students.Thus, 20 students scored 80 or above on the test.
Complete the frequency distri-
bution table for the data below. Work Practice 6
Each number represents a
credit card owner’s unpaid Now we will look at a way to construct histograms.
balance for one month.
The daily high temperatures for 1 month in New Orleans, Louisiana, are recorded
0 53 89 125 in the following list:
265 161 37 76
85° 90° 95° 89° 88° 94°
62 201 136 42
87° 90° 95° 92° 95° 94°
82° 92° 96° 91° 94° 92°
Class Class
Intervals Frequency 89° 89° 90° 93° 95° 91°
(Credit Card (Number of
Balances) Tally Months) 88° 90° 88° 86° 93° 89°
The data in this list have not been organized and can be hard to interpret. One way
$0–$49 ____ ____
to organize the data is to place them in a frequency distribution table. We will do
$50–$99 ____ ____
this in Example 7.
$100–$149 ____ ____
$150–$199 ____ ____
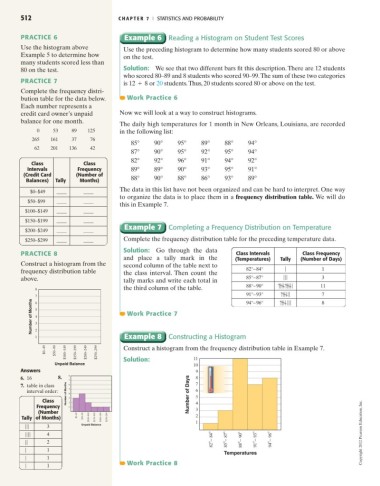
Example 7 Completing a Frequency Distribution on Temperature
$200–$249 ____ ____
$250–$299 ____ ____ Complete the frequency distribution table for the preceding temperature data.
Solution: Go through the data
PRACTICE 8 Class Intervals Class Frequency
and place a tally mark in the (Temperatures) Tally (Number of Days)
Construct a histogram from the second column of the table next to
frequency distribution table the class interval. Then count the 82°–84° | 1
above. tally marks and write each total in 85°–87° ||| 3
the third column of the table. 88°–90° |||| |||| | 11
8
91°–93° |||| || 7
7 6 94°–96° |||| ||| 8
Number of Months 5 4 3 Work Practice 7
1 2 Example 8 Constructing a Histogram
$0–49 $50–99 $100–149 $150–199 $200–249 $250–299 Construct a histogram from the frequency distribution table in Example 7.
Unpaid Balance Solution: 11
10
Answers 9
6. 16 8. 8 8
7
7. table in class 6 7
interval order: Number of Months 5 4 Number of Days 6
Class 3 2 5
4
Frequency 1 3
(Number
Tally of Months) $0–49 $50–99 $100–149 $150–199 $200–249 $250–299 2
Unpaid Balance 1
||| 3
|||| 4 Copyright 2012 Pearson Education, Inc.
|| 2 82– 84 85– 87 88– 90 91– 93 94– 96
| 1
Temperatures
| 1
Work Practice 8
| 1